
Figure 9.
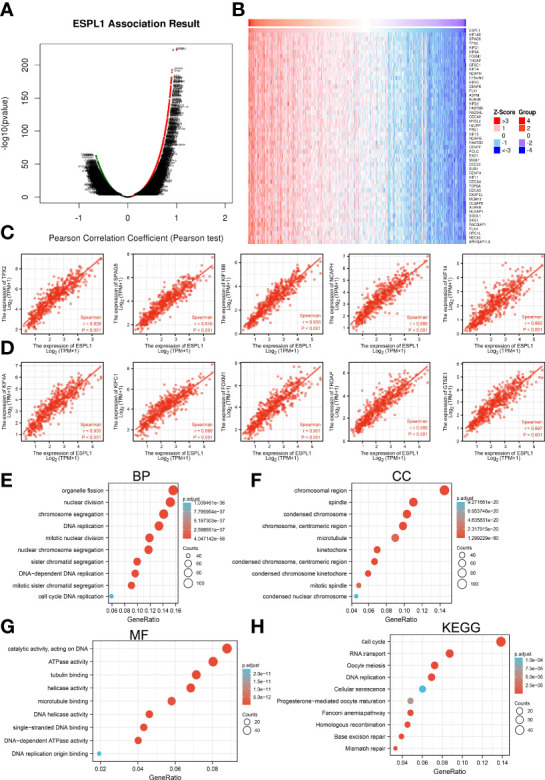
KEGG enrichment analysis of ESPL1. (A–D) Identified genes with positive co-expression with ESPL1 using the TCGA database. (E–H) GO and KEGG enrichment analysis of ESPL1 in LUAD.
Official websites use .gov
A
.gov website belongs to an official
government organization in the United States.
Secure .gov websites use HTTPS
A lock (
) or https:// means you've safely
connected to the .gov website. Share sensitive
information only on official, secure websites.
KEGG enrichment analysis of ESPL1. (A–D) Identified genes with positive co-expression with ESPL1 using the TCGA database. (E–H) GO and KEGG enrichment analysis of ESPL1 in LUAD.