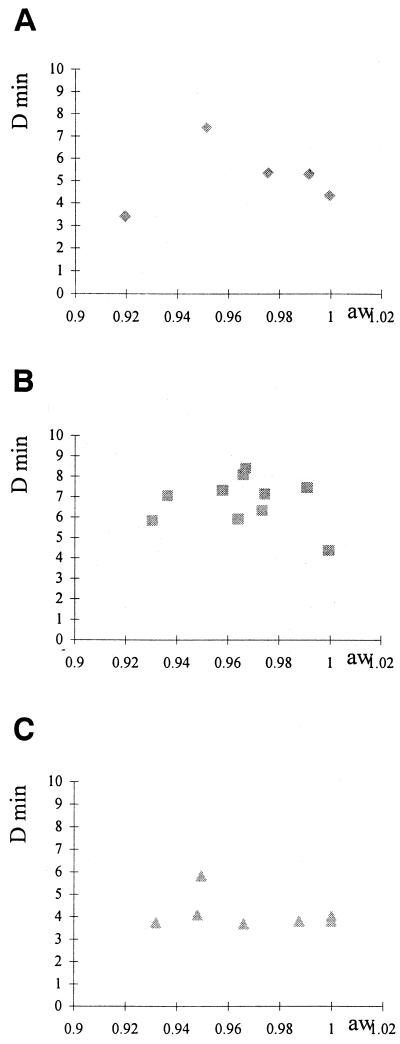
FIG. 5.
(A) B. cereus D95°C value versus the aw of both heated and recovery medium adjusted with sucrose. Symbols: ○, experimental data; —, calculated values of aw according to equation 2. (B) B. cereus D95°C value versus the aw of both heated and recovery medium adjusted with glucose. Symbols: □, experimental data; —, calculated values according to equation 2. (C) B. cereus D95°C value versus the aw of both heated and recovery medium adjusted with sucrose. Symbols: ▵, experimental data; —, calculated values according to equation 2.

