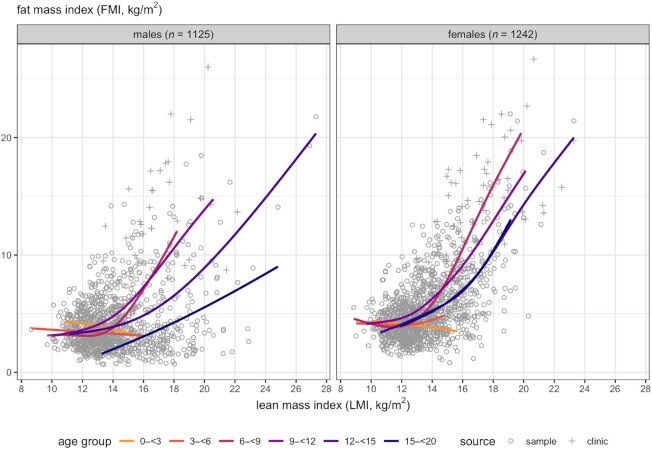
FIGURE 3.
Scatterplots and cubic P-spline regression curves of FMI against LMI from Figure 2, superimposed by age group, for males and females separately. Points are color-coded by age group: yellow 0 to <3 y; orange 3 to <6; pink 6 to <9; mauve 9 to <12; purple 12 to <15; navy blue 15 to <20. Obesity clinic patients shown as “+.” FMI, fat mass index; LMI, lean mass index.

