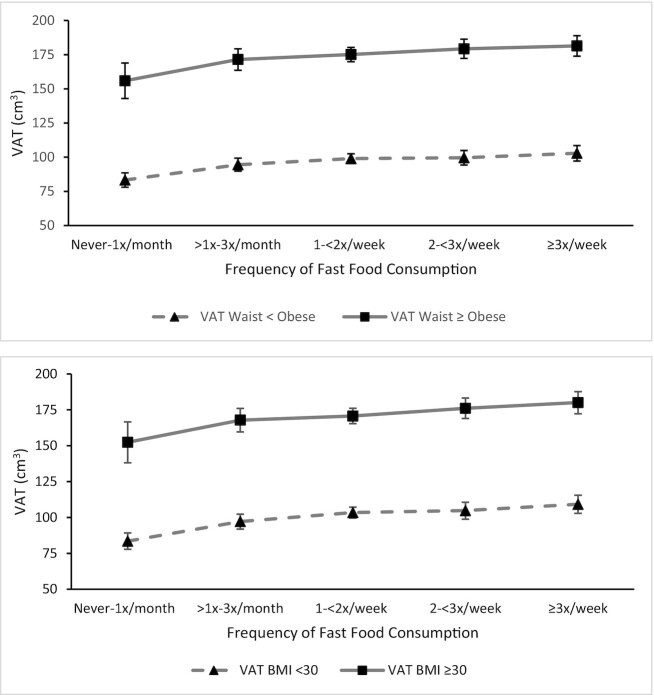
FIGURE 1.
Visceral adipose tissue levels in middle age according to categories of average fast-food intake over preceding 25 y: stratification by concurrent (year 25) anthropometric-defined obesity thresholds in Coronary Artery Risk Development in Young Adults. All values reported as mean (95% CI). BMI <30, n = 1747; BMI ≥30, n = 1395, P–linear trend = <0.0001 BMI <30, 0.002 BMI ≥30. Waist circumference (WC) < obese, n = 1723; WC obese, n = 1427, P–linear trend = 0.0002 < obese, 0.003 obese. VAT, visceral adipose tissue.

