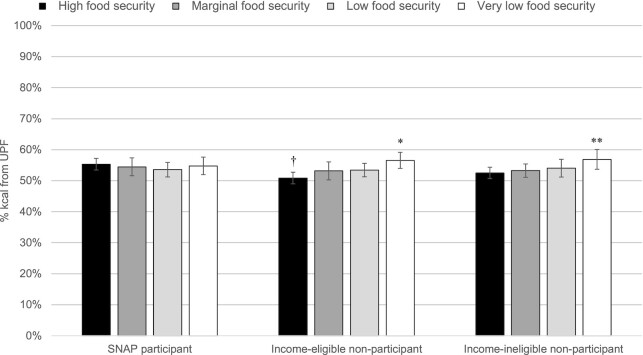
FIGURE 1.
Least squared means from multivariable linear regression models of ultra-processed food intake by household food security status and SNAP participation adjusted for sociodemographic and health characteristics, NHANEs 2007–2016 (n = 9190). P-interaction between household food security and SNAP participation was 0.02. *Significant difference from income-eligible nonparticipants with high food security P = 0.0002; **significant difference from income-ineligible nonparticipants with high food security P = 0.03; †significant difference from SNAP participants with high food security P = 0.002. SNAP, Supplemental Nutrition Assistance Program.

