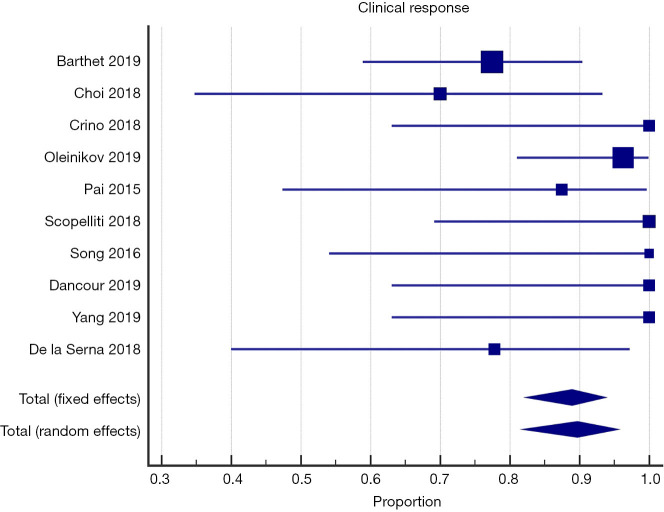
Figure 2.
Forest plot for overall clinical response. Size of the square is proportional to the precision of the study-specific effect estimates, and the bars indicate the corresponding 95% CIs. The diamond is placed on the summary correlation coefficient of the observational studies, and the width indicates the corresponding 95% CI.

