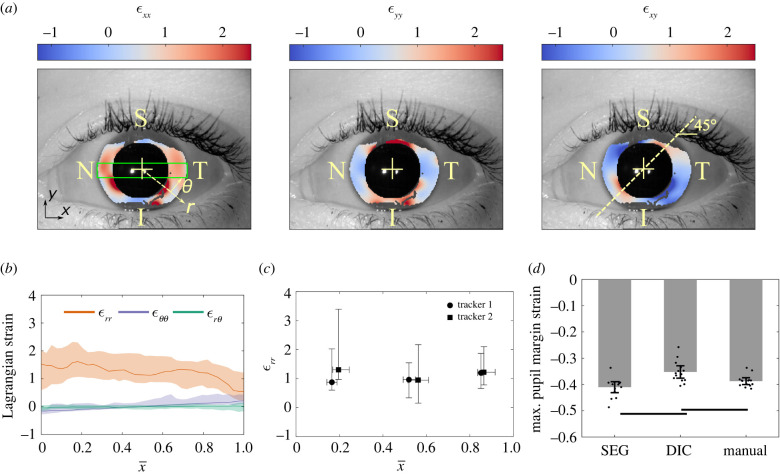
Figure 2.
(a) Representative in-plane iridial Lagrangian strain field determined using digital image correlation (DIC). The colours indicate the strain at maximum pupillary constriction in the reference configuration. The strain fields demonstrate a symmetrical deformation, i.e. εxx is essentially symmetric about the x-axis, εyy is symmetric about the y-axis and εxy is diagonally antisymmetric. The colour bar spans 95% of the CI of the data. S, N, I and T denote superior, nasal, inferior and temporal, respectively. (b) The spatial distribution of in-plane iridial strain components in a normalized coordinate system. The median and interquartile range (IQR; shaded areas) are shown for the ROI (green box in panel a left, with height equal to one-half of the pupil radius during the acclimation phase, and width equal to the limbus diameter), where for the pupillary margin, and for the limbus. It is evident that there are significant deformations over the entire iris; for example, εrr is 1.53 [0.59, 2.01] (median and IQR) at the pupillary margin. The median value of εrr is essentially constant across much of the iris and then decreases to 0.54 [0.21, 1.22] at the limbus. As expected, εθθ and were small compared with . was negative at the pupillary margin (indicating sphincter constriction), and due to the symmetry of deformation, was essentially zero. (c) We validated the DIC results by having two trackers annotate structural features manually to calculate εrr. By comparing the medians and IQR of εrr, it is evident that both trackers acquired similar results compared with DIC. In addition, the results of the two trackers were not different from each other. The vertical and horizontal error bars indicate IQR. (d) To further validate the DIC results, we measured the pupil strain by calculating the average pupil margin strain at maximum constriction (manual) and compared it with pupil margin strain results from DIC analyses (DIC) and Daugman's method (SEG). Results obtained by the three methods showed reasonable agreement, with the maximum difference of approximately 15% occurring between DIC and SEG (p < 0.01). Error bars indicate 95% CI. The horizontal bars indicate p < 0.05/3.

