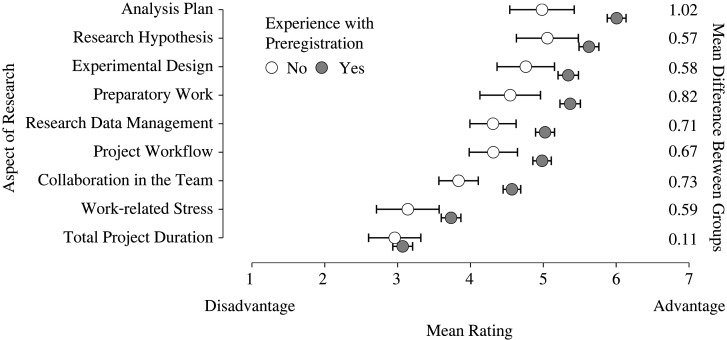
Figure 1.
Respondents’ opinion on how preregistration influenced different aspects of the research process. Grey dots represent the mean ratings from respondents who have experience with preregistration and white dots represent the mean ratings from respondents who have no experience with preregistration. The square skewers represent 95% confidence intervals. Ratings above and below 4 indicate that preregistration helped and harmed a certain research aspect, respectively.

