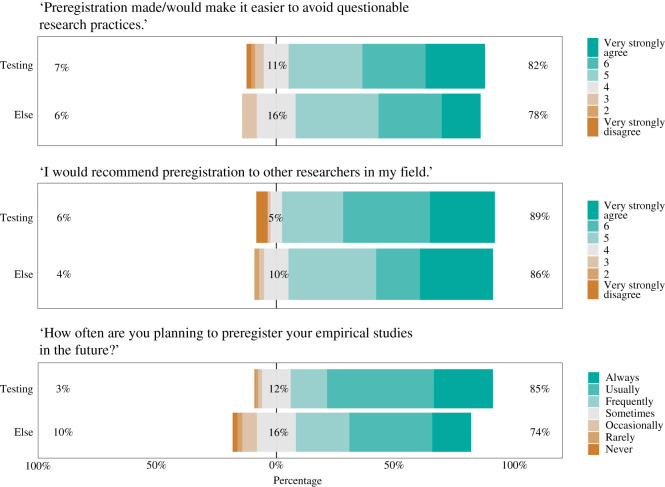
Figure 4.
Respondents’ general opinion about preregistration. The top bar represents answers from respondents whose main empirical approach was hypothesis-testing, the bottom bar represents answers from respondents whose main empirical approach was different. For each survey question, the number to the left of the data bar (in brown/orange) indicates the percentage who (slightly or strongly) disagreed or who would recommend preregistration occasionally or less frequently. The number in the centre of the data bar (in grey) indicates the percentage who responded with ‘neither agree or disagree’ or ‘neutral’. The number to the right of the data bar (in green/blue) indicates the percentage who (slightly or strongly) agreed or who would recommend preregistration frequently or more.

