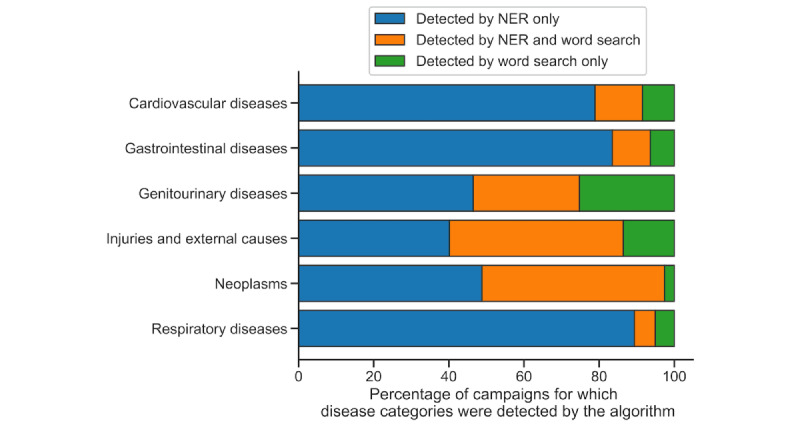
Figure 2.

The relative contributions of the NER model and word search to detecting disease categories. All campaigns for which the disease categories on the y-axis were detected by the disease identification algorithm are presented. The colored bars represent the percentage of those campaigns for which the disease categories were detected by the NER model only (blue), the NER model and word search (orange), or the word search only (green). NER: named entity recognition.
