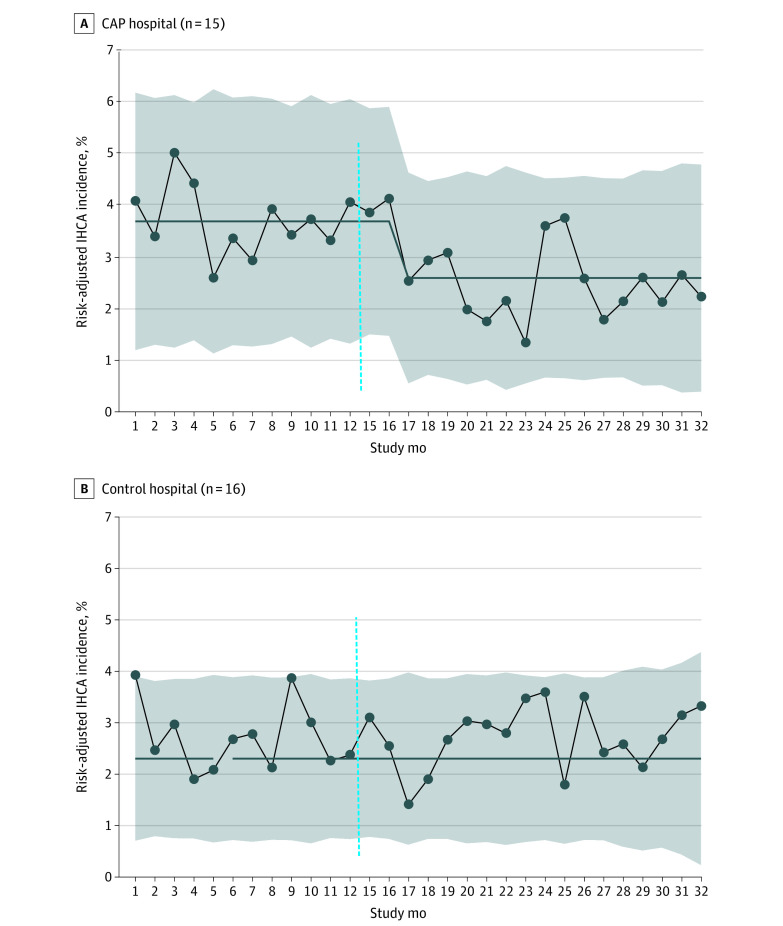
Figure 2. Aggregate Monthly Risk-Adjusted In-Hospital Cardiac Arrest (IHCA) Incidence in Cardiac Arrest Prevention (CAP) Hospitals Compared With Control Hospitals.
Comparative statistical process control P charts showing aggregate monthly risk-adjusted IHCA incidence at 15 CAP hospitals and 16 control hospitals. At CAP hospitals, starting in study month 18 during the intervention period, there was significant IHCA reduction, with special cause variation as determined by 8 consecutive months below the baseline rate. There was centerline shift, representing a 30% reduction in mean aggregate IHCA incidence from 3.7% to 2.6%. At control hospitals, there was no change in baseline risk-adjusted IHCA incidence (2.7%). The baseline period included study months 1 to 12, and the intervention period included study months 15 to 32. There was a 2-month transition period (dotted vertical line).

