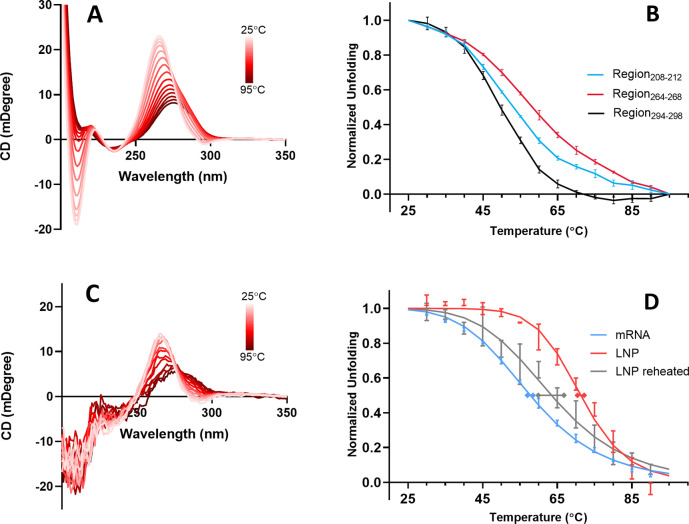
Figure 5.
(A) Circular dichroism spectra of mRNA recorded on a Jasco J1500 spectrometer at successively increasing temperatures of 5 °C increments from 25 to 95 °C. (B) Thermal unfolding trajectories measured from integrated areas of the three wavelength regions indicated, which correspond to distinct CD spectral bands. (C) CD spectra of mRNA-LNP recorded at successively increasing temperatures in 5 °C increments from 25 to 95 °C. (D) Thermal unfolding of mRNA measured by monitoring the CD spectral area in the region of 264–268 nm. Shown in blue is the unfolding curve of free mRNA (in buffer). The red data corresponds to the unfolding trajectory of the same mRNA encapsulated in LNP. The gray curve corresponds to the same mRNA-LNP sample cooled from 95 °C and then heated again from 25 °C. Experimental averages and standard deviations are based on 3 independent experiments. Normalized data, y, were fit with the Hill equation, y = 1/[1 + (Tm/T)Hill] where the superscript “Hill” refers to the Hill coefficient. Tm and Hill coefficient values are presented in Table 1.

