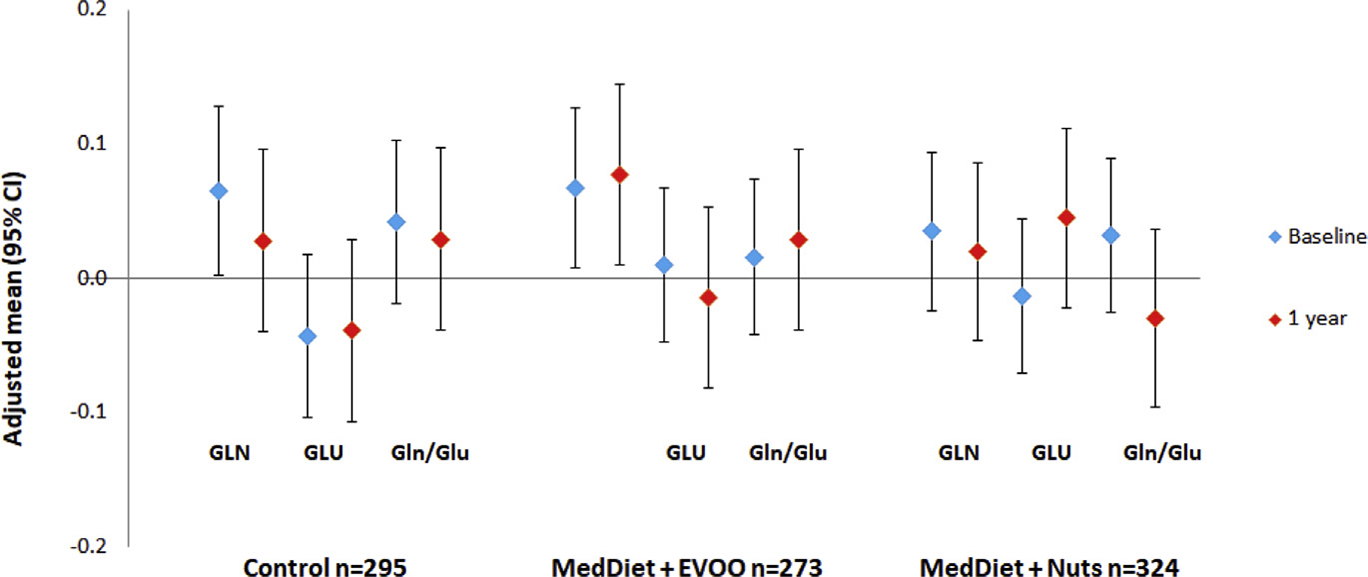
Figure 2.

Glutamine (GLN), glutamate (GLU), glutamine-to-glutamate ratio (Gln/Glu) at baseline and changes after 1 year of intervention. Values were adjusted for age (years), sex (male, female), body mass index (kg/m2), smoking (never, current, former), leisure-time physical activity (metabolic equivalent tasks in minutes/day), dyslipidemia, hypertension, and baseline metabolites levels. Blue diamond: baseline metabolites levels, red diamond: metabolites levels at 1 year Sample size was from baseline. (For interpretation of the references to color in this figure legend, the reader is referred to the Web version of this article.)
