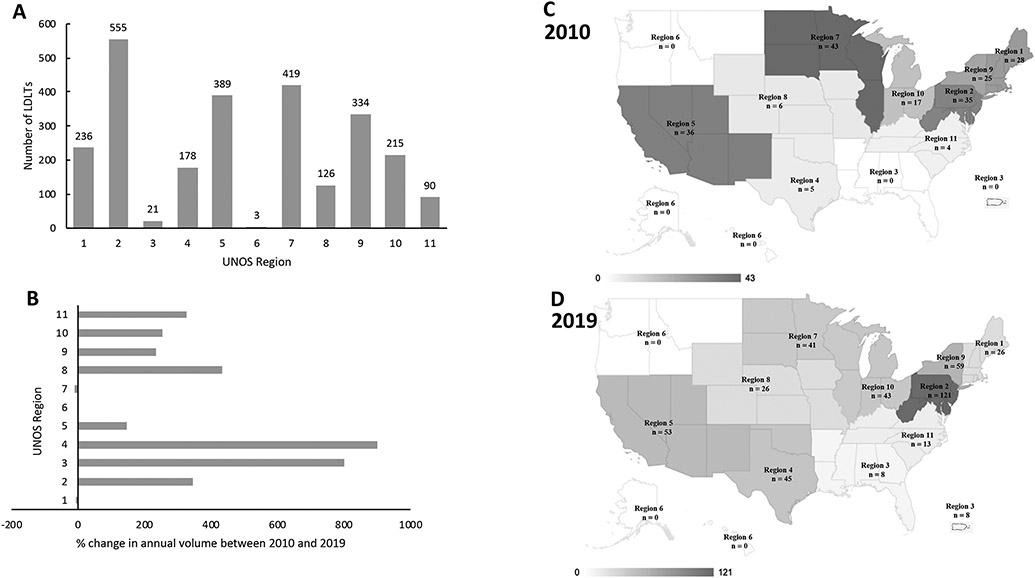
Figure 2. Geographic variation of living donor liver transplantations in the USA 2010 – 2019 stratified by UNOS region.
The bar charts display the (A) overall number and (B) % change between 2010 and 2019, while the maps show the number of LDLTs performed in (C) 2010 and (D) 2019 in respective UNOS regions. LDLTs, living donor liver transplantations; UNOS, United Network for Organ Sharing.

