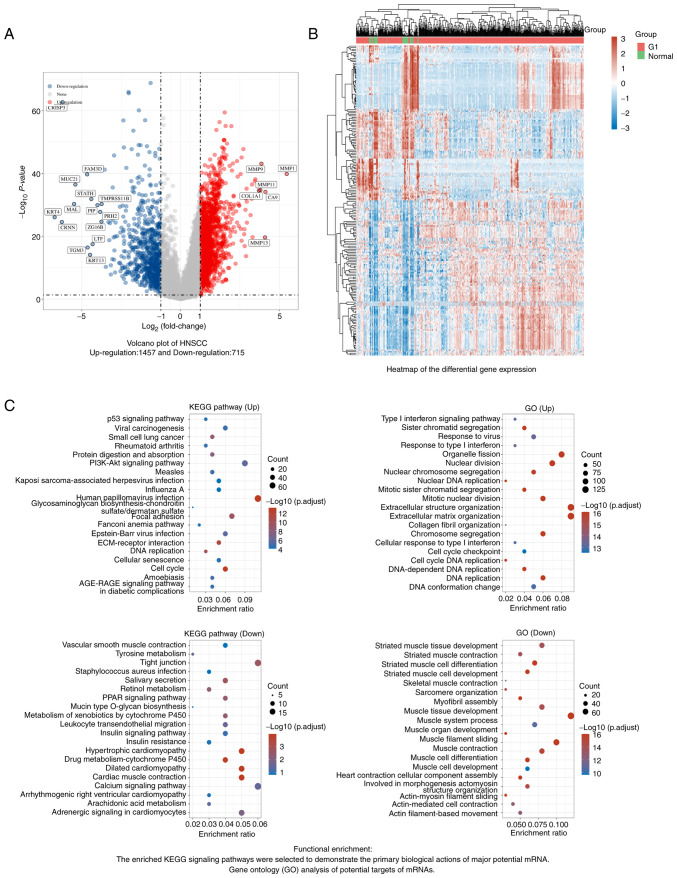
Figure 1.
DEGs in HNSCC. (A) Volcano plot: The volcano plot was constructed using the fold change values and adjusted P-value. Red dots indicate upregulated genes (n=1,457) and blue dots indicate downregulated genes (n=715); grey dots indicate genes with insignificant changes. (B) Heatmap of differential gene expression in HNSCC. Different colors represent the trend of gene expression. The top 50 upregulated genes and the top 50 downregulated genes are presented in this figure. (C) Functional enrichment analysis. Left panel: The enriched KEGG signaling pathways were selected to demonstrate the primary biological roles of the differentially expressed mRNAs. The abscissa indicates the gene ratio and the enriched pathways are presented on the ordinate. Right panel: GO analysis of HNSCC DEGs. The biological process, cellular component and molecular function terms of potential targets were clustered using the Cluster Profiler package in R software (v 3.18.0). Colors represent the significance of differential enrichment and the size of the circles represents the number of genes with a larger circle indicating a higher number of genes. Pathways with P<0.05 and false discovery rate <0.05 were considered to be meaningful pathways [enrichment score of-log10(P) >1.3]. HNSCC, head and neck squamous carcinoma; GO, Gene Ontology; KEGG, Kyoto Encyclopedia of Genes and Genomes; Up, upregulated genes; Down, downregulated genes.

