
FIGURE 4.
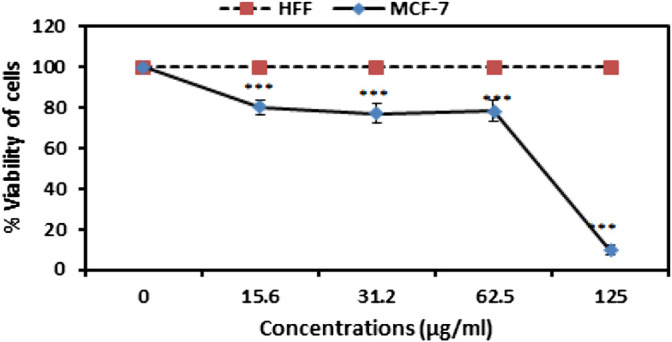
Analysis of MCF-7 and HFF cell viability in treatment with various concentrations of SEO-SCF-NPs. The results were represented as mean ± SD and “***” p < 0.001.
Official websites use .gov
A
.gov website belongs to an official
government organization in the United States.
Secure .gov websites use HTTPS
A lock (
) or https:// means you've safely
connected to the .gov website. Share sensitive
information only on official, secure websites.
Analysis of MCF-7 and HFF cell viability in treatment with various concentrations of SEO-SCF-NPs. The results were represented as mean ± SD and “***” p < 0.001.