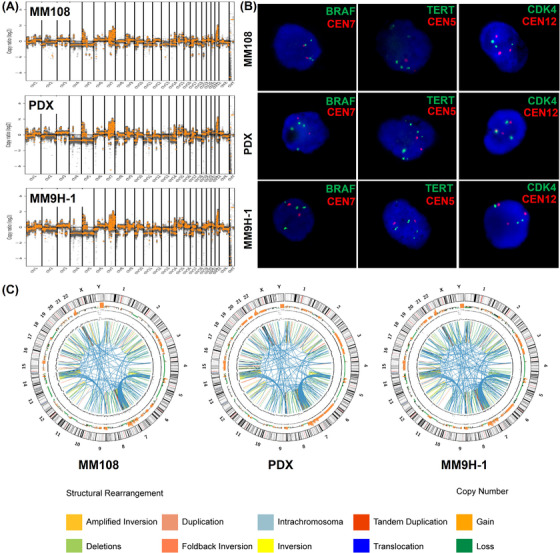
FIGURE 4.

The distribution of the amplified regions and the highly rearranged regions in MM108 primary tumor, PDX and MM9H‐1 cells. (A‐B) The feature of copy number variations and FISH analysis of the amplified regions including BRAF, TERT and CDK4 amplification in MM108 primary tumor, PDX and MM9H‐1 cells. (C) Circos plot depicts the genomic location in the outer ring and chromosomal copy number in the inner ring (orange, copy gain; green, copy loss). Different structural arrangements are shown in different colors, respectively. Abbreviations: PDX, patient‐derived tumor xenografts; FISH, fluorescence in situ hybridization; BRAF, v‐raf murine sarcoma viral oncogene homolog b1; TERT, telomerase reverse transcriptase; CDK4, Cyclin‐dependent kinase 4.
