
Figure 1.
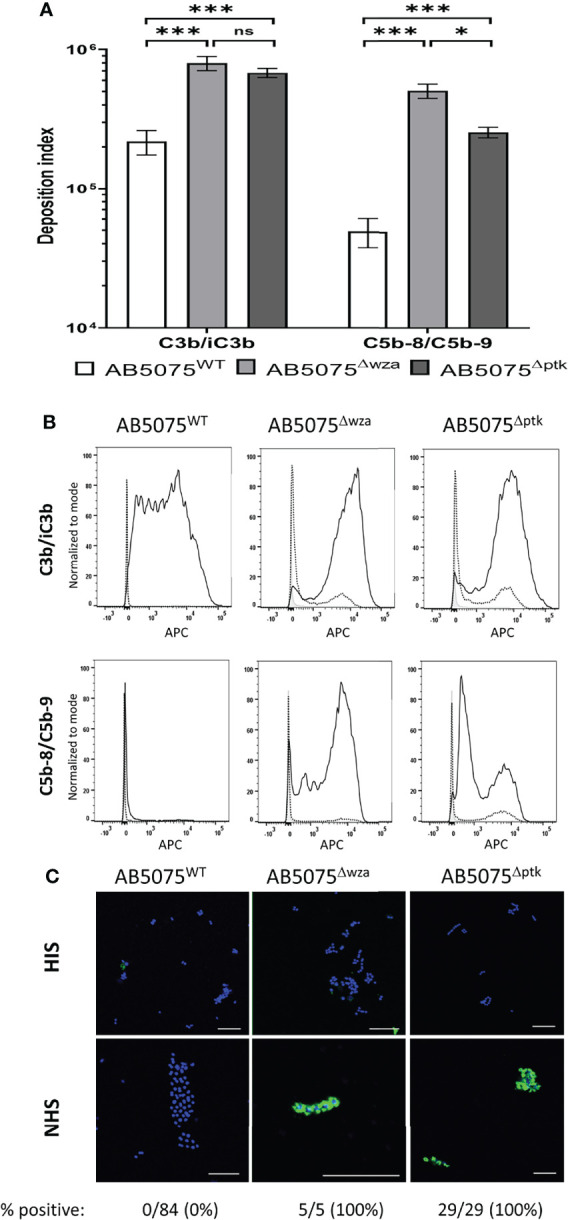
C3b/iC3b and C5b-8/C5b-9 deposition on the surface of wild-type and unencapsulated AB5075 isolates. 106 CFU of bacteria was incubated with 25% normal human sera followed by incubation with either the mouse monoclonal antibody 6C9 (Millipore) or aE11 (Abcam) and detected using an anti-mouse IgG conjugated to either allophycocyanin (APC) (Jackson Immunoresearch) (A) Bar graph showing the deposition index calculated by multiplying the percentage of bacteria staining positive for the respective complement factor and the median fluorescent intensity of the positive population. Bacteria incubated with PBS only followed by the primary and secondary antibody was used to determine the negative population. (B) Representative histograms showing the deposition of C3b/iC3b (top panel) and C5b-8/C5b-9 (bottom panel) on 106 CFU of the AB5075WT, AB5075Δwza and AB5075Δptk strains. Each graph shows a grey histogram that represents bacteria labelled with primary and secondary antibody only, while the black dotted and solid line represent bacteria incubated with heat-inactivated or normal human sera respectively. (C) Confocal imaging showing C5b-8/C5b-9 deposition on wild-type and unencapsulated AB5075Δwza and AB5075Δptk isolates following incubation with heat-inactivated sera (HIS) (top panel) or normal human sera (NHS) (bottom panel). Blue represent DAPI stained bacteria and green shows bacteria positive for MAC deposition. Figures below each panel represent the percentage of bacterial cells in each panel showing atleast some green fluorescent staining representing MAC deposition. A scale bar equivalent to 10 µm is indicated by a white line in all images. Bars represent mean values for each condition/strain and the error bars indicate standard deviations (SDs) (n = 3). T-test was used for statistical analysis *: p-value < 0.05, ***: p-value < 0.001, ns: p-value > 0.05. Representative data from two independent experiments is shown.