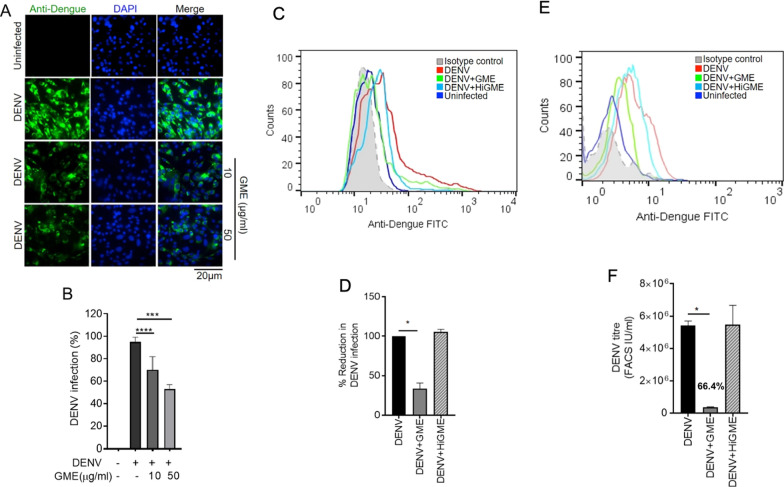
Fig. 3.
GME show anti-viral effect against DENV. A Vero cells were infected with DENV-2 (moi 2) virus for 48 h. Immunofluorescence image presents the number of DENV-2 positive Vero cells treated with two doses of GME. B Bar graph showing percentage of DENV-2 positive cells quantified using Image J (NIH) software. Data is represented as mean ± SD from ten dissimilar fields of three independent experiments. C–F Vero cells were infected with DENV-2 (moi 2) virus and cultured with 50 µg/ml goat exosomes (GME) or 50 µg/ml of heat inactivated goat exosomes (HiGME) for 48 h. Following incubation, the culture supernatant was collected. DENV-infection was analyzed in the cells while the infectious viral yield was analyzed in culture supernatants. C Histogram FACS plot showing DENV-2 infection in cells. D Bar graph showing the percentage of reduction in DENV-2 infection upon treatment with goat exosomes in DENV-2 infected Vero cells. Data is mean ± SD from three independent experiments. *P < 0.05, ***P < 0.001, ****P < 0.0001 was considered significant. E Fresh Vero cells were infected with culture supernatants for 24 h and viral yield/titre was determined through FACS. Histogram FACS plot showing DENV-2 infection. F Bar graph displays the viral titre (FACS IU/ml) in the culture supernatants. Data is mean ± SD from three independent experiments. Statistical analysis through Mann Whitney t-test (B) and two –tailed unpaired Student’s t test (D, F)

