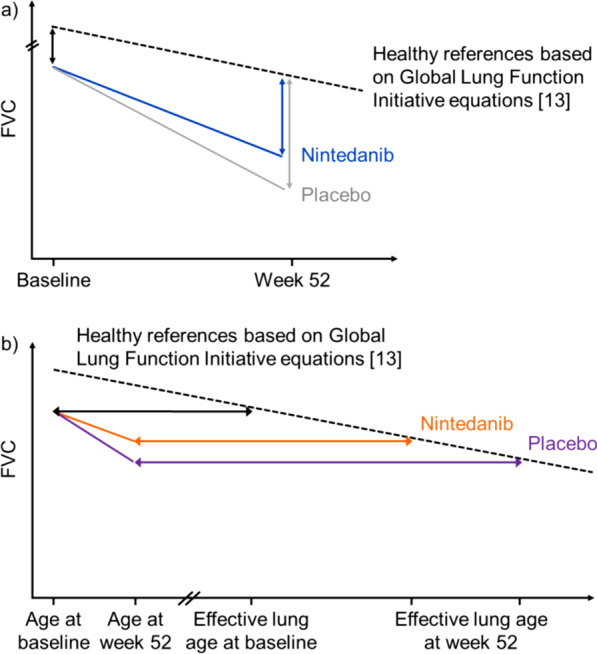
Fig. 1.

Schematic illustration of a the course of FVC decline in patients in the SENSCIS trial and healthy reference subjects and b the difference between effective lung age and actual age in subjects in the SENSCIS trial. In figure a, the black dashed line denotes the decline in FVC in the hypothetical healthy reference population; the coloured lines denote the decline in FVC in the nintedanib (blue) and placebo (grey) groups in the SENSCIS trial; the coloured vertical arrows denote the differences in FVC between the nintedanib (blue) and placebo (grey) groups in the SENSCIS trial and the hypothetical healthy reference population at week 52. In figure b, the black horizontal line denotes the difference between actual age and effective lung age at baseline; the coloured horizontal arrows denote the differences between actual age and effective lung age at week 52 in the nintedanib (orange) and placebo (purple) groups in the SENSCIS trial
