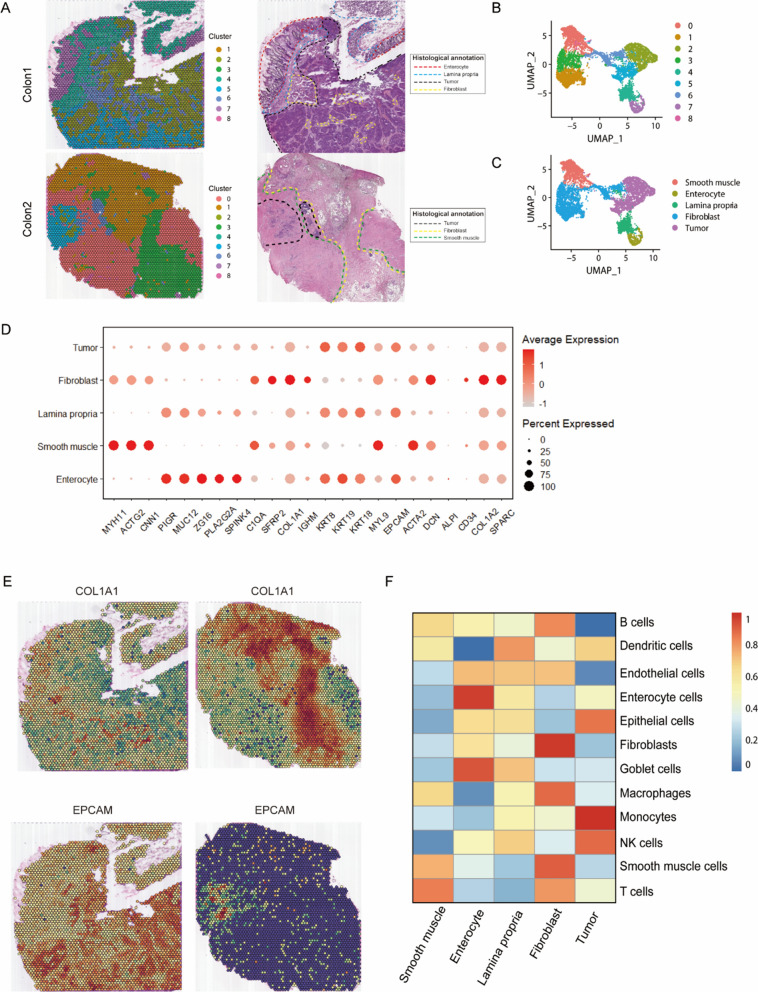
Fig. 1.
Spatial transcriptomics (ST) to identify intra-tumor heterogeneity in colorectal cancer. A Spatial images of unsupervised clustering results (left) and hematoxylin–eosin staining (H&E) sections annotations (right). B, C UMAP plot of cell types and PCA clustering result profiled in the presenting work. D The expression level of cell markers across different morphological regions through the Dot plot. E Spatial plots show the spatial expression pattern of fibroblast and tumor markers (COL1A1, EPCAM) in this study. F Heatmap of cell-type scores estimated by ssGSEA

