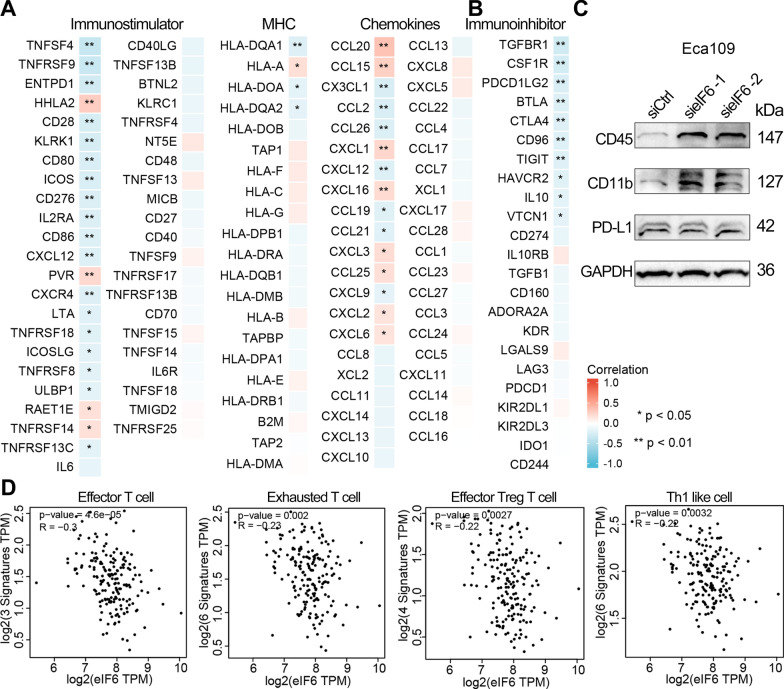
Fig. 8.
Correlation between eIF6 expression and immune-related genes in human ESCA. A A heatmap showing the spearman’s rank correlation between eIF6 expression level and immunostimulators, MHC genes, chemokines, and immunoinhibitors B based on the TISIDB database. Positive and negative correlation are indicated by red and blue, respectively. C Western blot analysis for CD45, CD11b, and PD-L1 in Eca109 cells with eIF6 knockdown. D Scatter plots showing the correlation between immune cells infiltrations and the eIF6 expression using GEPIA2 database. *p < 0.05, **p < 0.01

