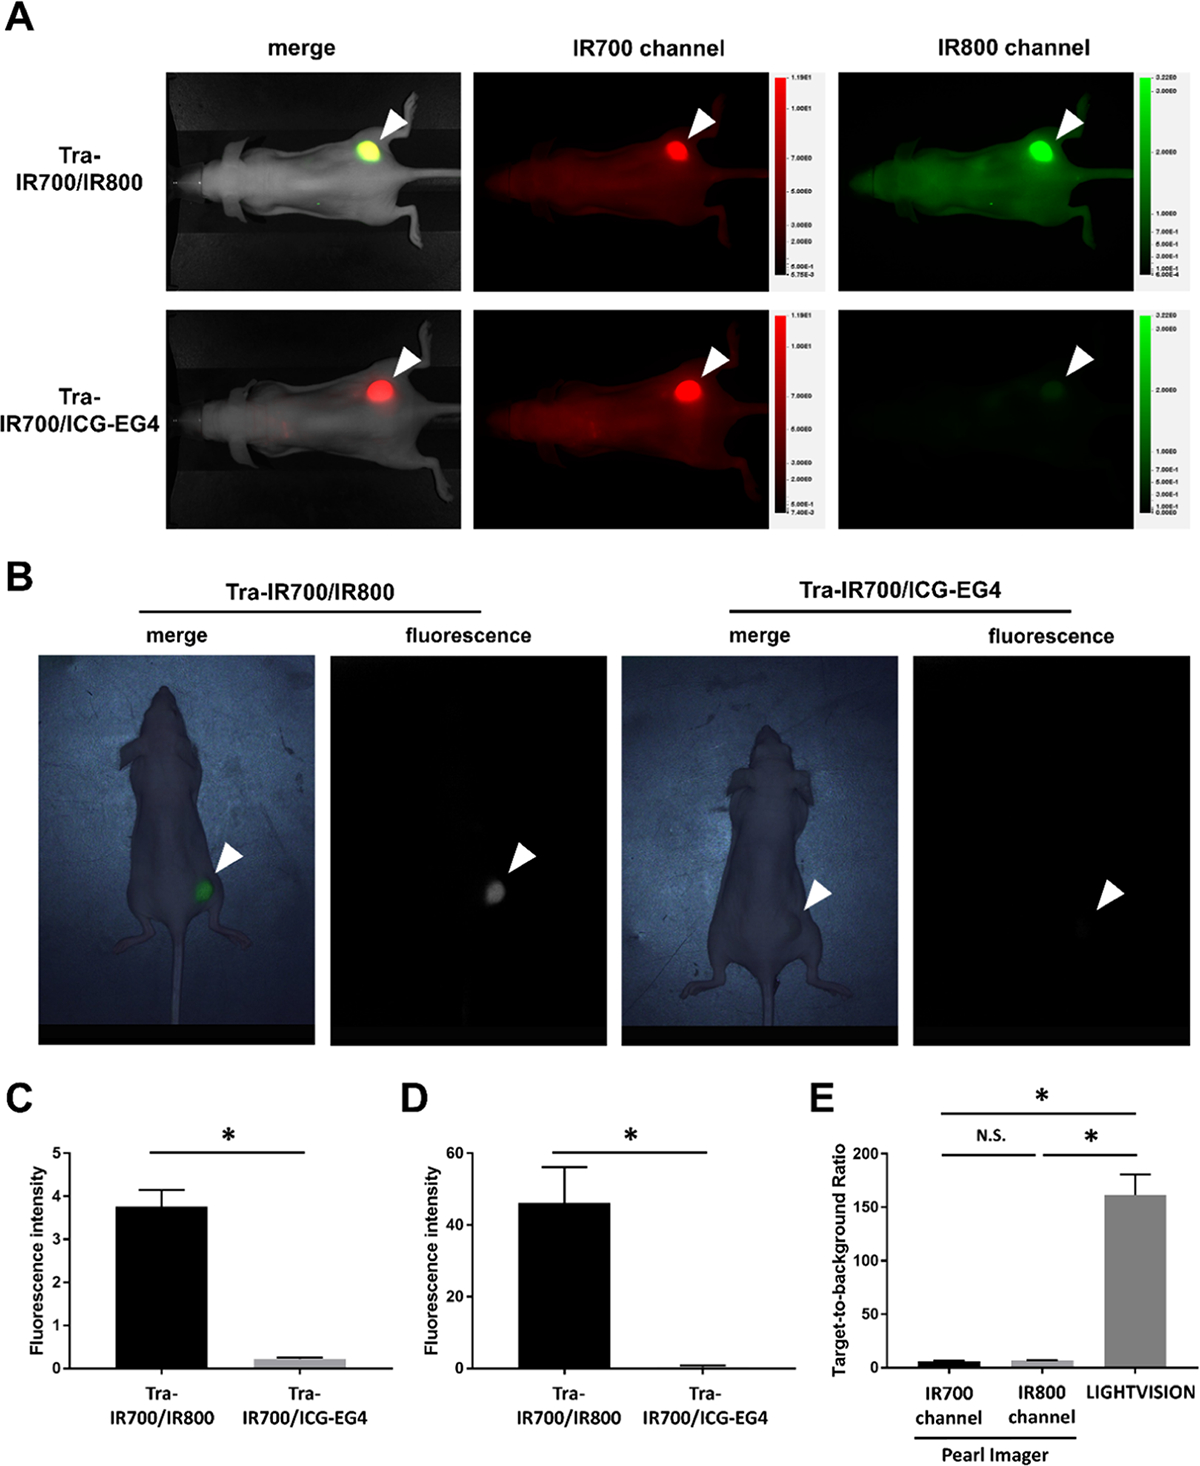
Figure 3.

In vivo imaging of Tra-IR700/IR800 and Tra-IR700/ICG-EG4: (A) Fluorescence images of Tra-IR700/IR800 and Tra-IR700/ICG-EG4 in N87-GFP/luc tumor-bearing mice obtained with the Pearl Imager. A white arrowhead indicates the location of the subcutaneous tumor. (B) Fluorescence images of Tra-IR700/IR800 and Tra-IR700/ICG-EG4 in N87-GFP/luc tumor-bearing mouse obtained by LIGHTVISION. A white arrowhead indicates the location of the subcutaneous tumor. (C) Fluorescence intensity in the tumor region observed with the Pearl Imager. Data are shown as mean ± SEM (n = 7, *p < 0.05). (D) Fluorescence intensity in the tumor region observed with LIGHTVISION. Data are shown as mean ± SEM (n = 7, *p < 0.05). (E) Target-to-background ratio of N87-GFP/luc tumor in each imaging device. Data are shown as mean ± SEM (n = 7, *p < 0.05).
