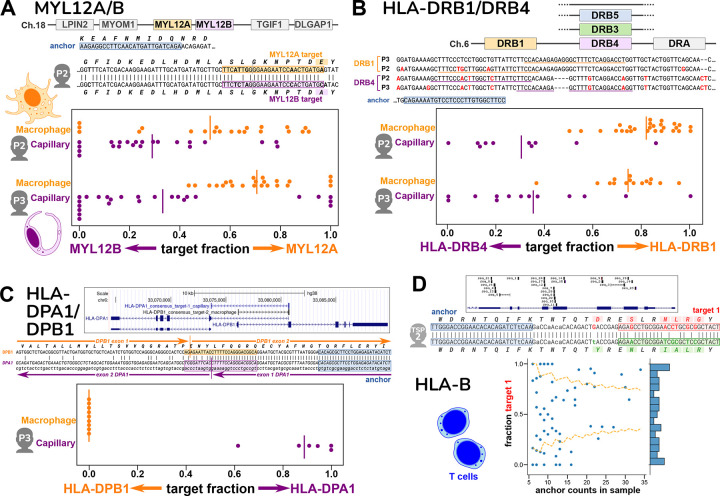
Figure 3. Cell-type specific expression of paralogs and HLA from single-cell data.
Figures A-C show spread plots, with each dot representing the relative isoform expression in a single cell; a bar marks the average relative expression across all the cells.
A. Human MYL12A and MYL12B lie adjacent on chromosome 18; this region is syntenic in mammals, chickens, and reptiles. The two genes are very similar in the coding region, as seen in the sequence alignment that also shows the locations of the anchor and two targets for individual P2 (anchor is distinct for P3). Macrophages express relatively more MYL12A and capillary cells more MYL12B, based on target fractions; this result is consistent in two different individuals.
B. The HLA-DRB locus occurs as several different haplotypes, all of which contain a DRB1 gene but differ in presence of a paralog (DRB3, DRB4, DRB5, or none; hg38 reference has DRB5). The anchor and targets lie in the somewhat similar 3’ untranslated regions of DRB1 and DRB4; however the two individuals have distinct alleles at both DRB1 and DRB4. Macrophages express mainly DRB1 and capillary cells mainly DRB4, based on target fractions.
C. The HLA-DPA1 and HLA-DPB1 genes overlap in a head-to-head arrangement as shown in the UCSC Genome Browser plot, which also shows the BLAT alignment of the consensus sequences for the DPA1 and DPB1 anchors. These lie on opposite strands of the genome. This is also depicted in the alignment of the two consensuses (which represent mRNA); the targets are best assigned to opposite strands, and the location of splice junctions corroborates the strandedness. An anchor reporting simultaneously on DPA1 and DPB1 was only found for individual P3; its targets show that macrophages exclusively express DPB1, while capillary cells express DPA1.
D. T cells from one individual showed a large number of anchors across the polymorphic HLA-B gene, as depicted in the UCSC Browser plot. We investigated one HLA-B anchor, which lies in exon 2. The hg38 reference is the B*07:02 allele, whereas alleles of this individual match best by BLAST to B*08 and B*51 (consensus 1 and 2). In the alignment, differences from hg38 in the anchor and lookahead region are shown in lowercase. Individual T cells show a wide range of expression ratios between the two HLA-B alleles (different target 1 fractions), as shown in the scatterplot. The yellow lines mark a 98% confidence interval for a distribution based on the population average (confidence depends on observation depth = anchor counts); the observed pattern differs (binomial p = 1.73E-25), and some cells express almost exclusively one allele over the other.

