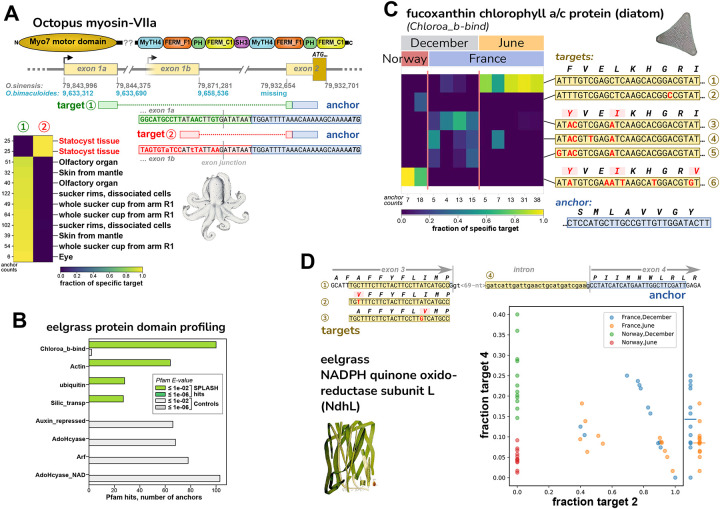
Figure 5. Discovery of regulated variation in non-model organisms: octopus and eelgrass.
A. SPLASH identified alternative transcripts in the O. bimaculoides Myo-VIIa motor protein that are expressed mutually exclusively; the target 2 isoform is only found in statocyst, a sound-responsive tissue. The transcripts have different first exons, presumably due to alternative transcription start sites; the start codon lies in the shared second exon. The sequence of the anchor and exon 2 are missing from the current O. bimaculoides genome assembly, but are in the closely related O. sinensis genome. Sequences for targets 1 and 2 are in both genomes, but the statocyst-specific transcript is not annotated. The O. sinensis assembly has the Myo-VIIa gene in two inverted pieces (at the point marked by ‘??’ in protein domain schematic; Note S5).
B. Two of the top domains identified from SPLASH anchors by protein domain profiling in eelgrass (Z. marina) samples are chlorophyll A-B binding protein (Chloroa_b-bind) and silicon transporter (Silic_transp); these derive from diatoms, based on BLAST protein alignment (Figure S7; Data S7). The other two top SPLASH domains, actin and ubiquitin, do not appear to derive from diatoms nor eelgrass, so may be from other epiphytic species.
C. A Chloroa_b-bind anchor, more specifically identified by protein BLAST as a fucoxanthin chlorophyll a/c protein from diatoms (Figure S7C), has several targets that are differentially abundant: the most common target (top row) is mainly found in France/June samples; three targets that encode the same protein sequence (middle) are found in France/December samples; and one target (bottom row) is only found in Norway/December samples.
D. An anchor from eelgrass, in the photosynthetic gene NdhL, has four major targets. Targets 1–3 are allelic coding variants (within a transmembrane region). Target 4 represents intron retention and would result in a shortened protein. The scatterplot shows that Norway samples of June vs. December (red vs. green) are perfectly segregated by the fraction of target 4 (intron retention). A similar but less marked trend is seen for France samples of June vs. December (yellow vs. blue) – at the right edge, fraction target 4 values are collapsed to one dimension, with averages marked by bars. The scatterplot also shows that Norway samples do not express target 2 at all (they express target 1 and 3, data not shown).

