. 2022 Jun 16;13(26):7933–7946. doi: 10.1039/d2sc02013k

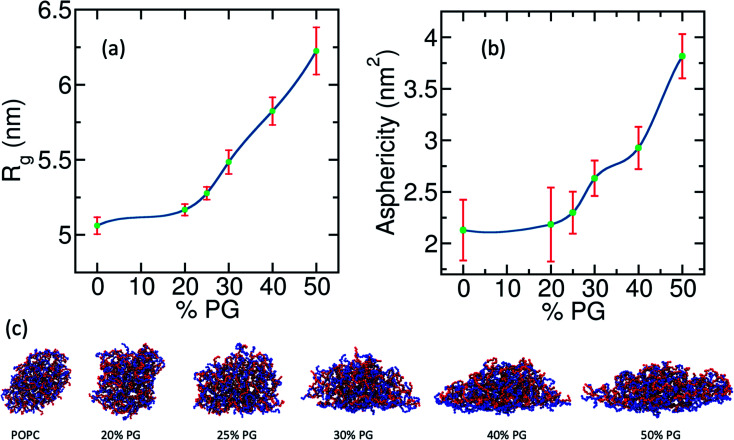
Fig. 4. Variation of the coacervate shape with respect to the fraction of POPG in the lipid membrane. (a) The radius of gyration of the polyelectrolyte coacervate along the Z-axis (membrane normal direction) quantifies the spread of the coacervate on the bilayer with increasing POPG concentration. (b) A measure of deviation from the spherical shape that captures the modulation in the shape of the droplet. (c) Representative snapshots of the coacervates in the presence of different lipid bilayers, viewed at normal to the Z-axis (The pure POPG system is not plotted as the polyelectrolyte coacervate completely wets the membrane surface and loses its globular shape).

Fig. 4