. 2022 Jun 10;13(26):7829–7836. doi: 10.1039/d2sc02050e

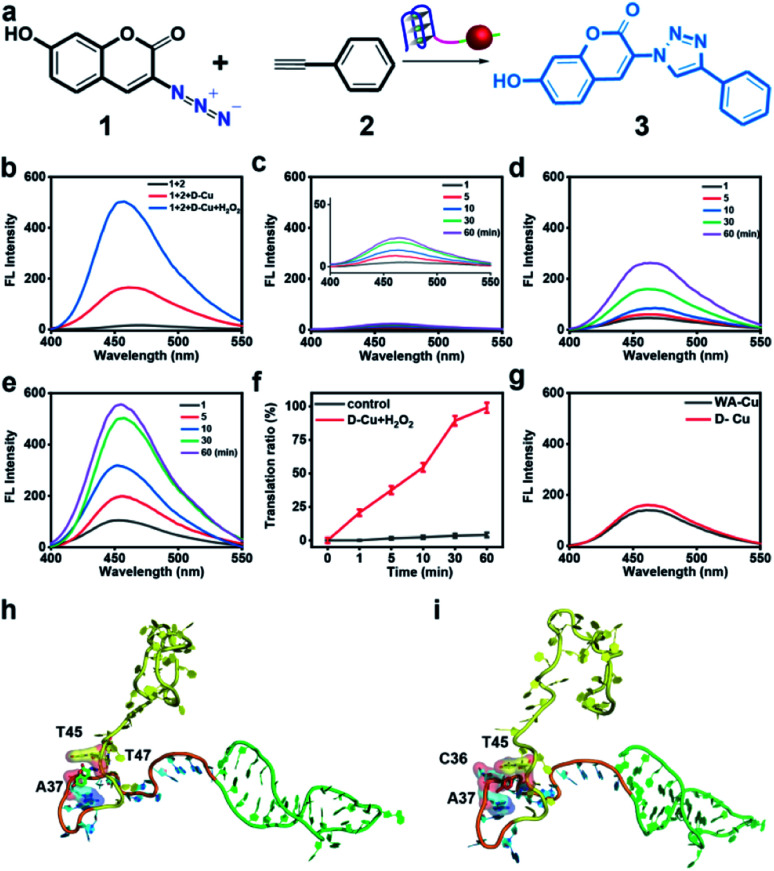
Fig. 2. CuAAC reaction of D-Cu in solution. (a) Schematic illustration of the structures of 1, 2, and 3 and D-Cu-catalyzed CuAAC reaction. (b) Fluorescence spectra of the D-Cu-catalyzed CuAAC reaction in H2O. The spectra were recorded after adding D-Cu and D-Cu + H2O2 respectively to 1 + 2 for 30 min (equivalent amount of Cu 5 μM). (c) Fluorescence changes of the mixture of 1 and 2 at 1, 5, 10, 30, and 60 min, respectively. (d) Fluorescence spectra of 1 + 2 + D-Cu at 1, 5, 10, 30, and 60 min, respectively. (e) Fluorescence spectra of 1 + 2 + D-Cu + H2O2 at 1, 5, 10, 30, and 60 min, respectively. (f) Translation ratio of 3 upon addition of D-Cu and H2O2 with time. Data are presented as mean ± SD (n = 3). (g) Fluorescence spectra of the D-Cu- and WA-Cu-catalyzed CuAAC reactions in H2O. (h and i) Molecular docking for simulating the binding mode of 1 and 2 with D-Cu, respectively.

Fig. 2