. 2022 Jun 16;19:E31. doi: 10.5888/pcd19.210459

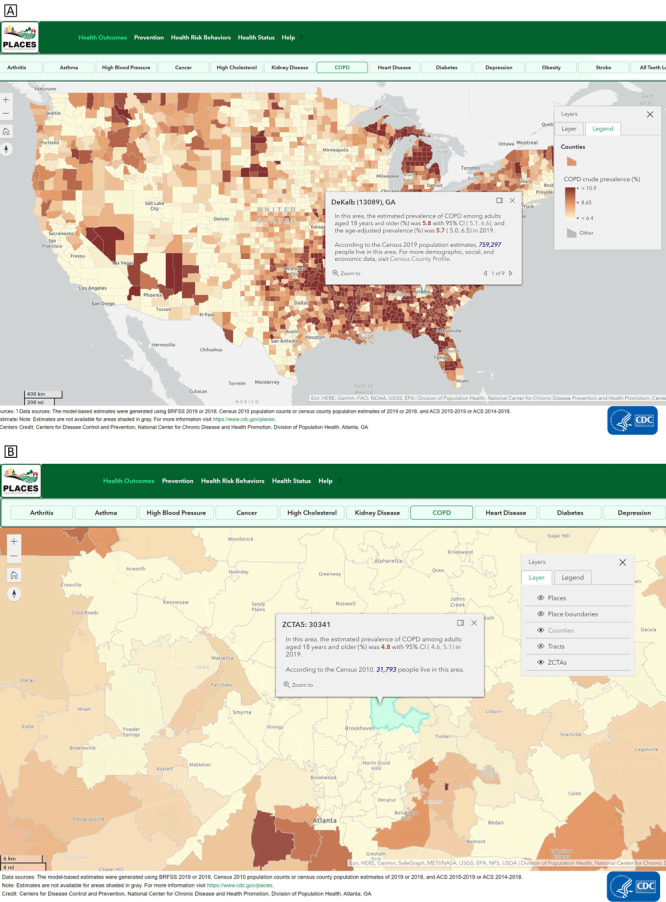
Figure 2.

A. Screenshot image of a PLACES interactive map.  Available health measures are shown at the top of the map with the health outcomes category and chronic obstructive pulmonary disease (COPD) measure selected. The map shows COPD levels at the county level. The legend shows the county as the geographic layer selected and a color key corresponding to prevalence estimates of COPD, from low to high, along with the county average. A pop-up box shows demographic information for a selected county.  B. Screenshot image showing features of the PLACES interactive mapping application.  The image shows the available health measures at the top of the map with health outcomes with COPD selected. The map shows COPD levels zoomed to the ZIP code tabulation area (ZTCA) level for the Atlanta, Georgia, area. The legend shows the ZCTA as the geographic layer selected. A pop-up box shows demographic information for a selected ZCTA.

PLACES interactive map application (www.cdc.gov/PLACES). Users can examine and visualize health data estimates across different geographic levels by using the PLACES interactive mapping application. By clicking a specific location, the selected measure (eg, estimated prevalence and crude prevalence) will appear for the selected chronic disease at that location. By zooming in and clicking on a particular geographic area, users can view the estimate for smaller geographic units. In Figure 2A, the county-level prevalence of COPD in Dekalb County, Georgia, is shown. Figure 2B displays COPD prevalence estimates at the ZIP Code tabulation area (ZTCA), which can be discerned by looking at the layer tool. Abbreviations: COPD, chronic obstructive pulmonary disease; PLACES, Population Level Analysis and Community EStimates.