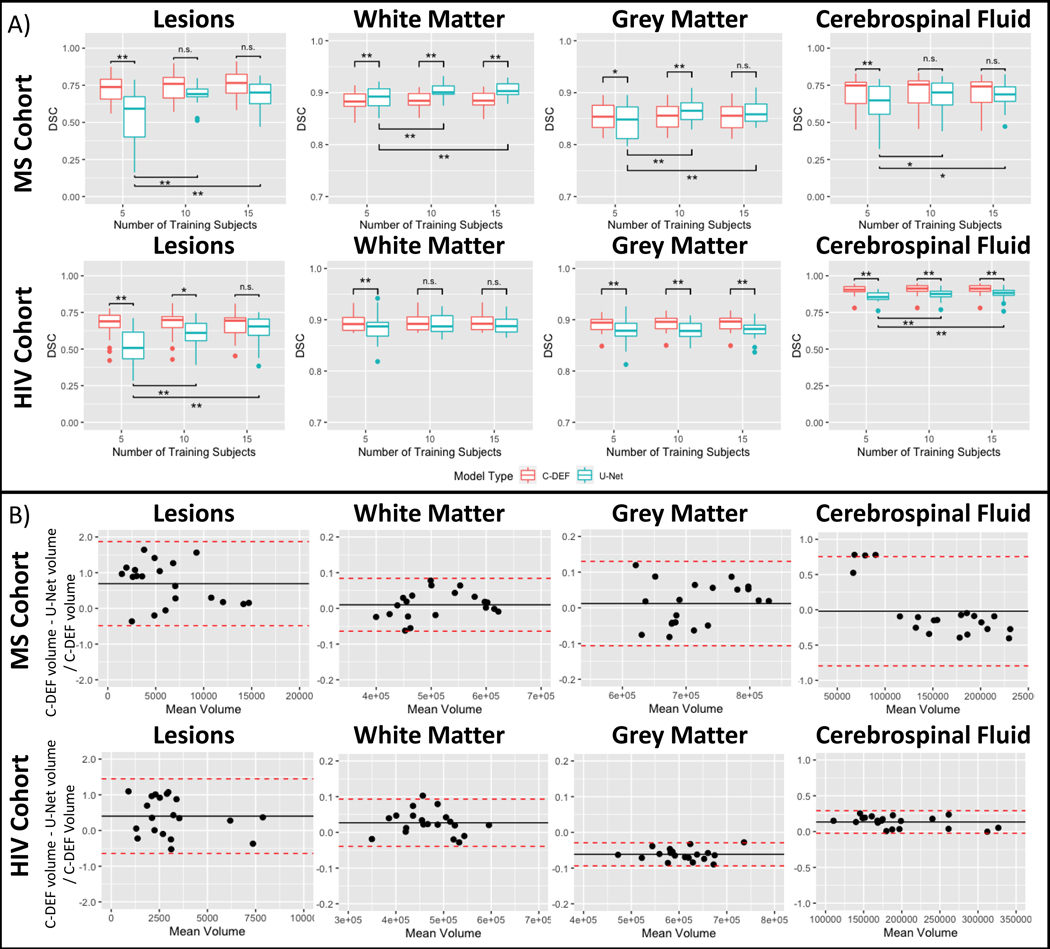
Figure 3: Comparison of U-Net and C-DEF segmentation:
(A) Dice Similarity Coefficient (DSC) of the output of the C-DEF and U-Net models with manually annotated mask, when trained with varied numbers of training data (5, 10, 15). Asterisks indicate statistically significant differences (* p < 0.05, ** p < 0.005). Note that DSC (y-axis) for white and grey matter is scaled 0.7–1.0 for better visualization. (B) Bland-Altman analysis of tissue volumes of C-DEF and U-Net trained on data from 5 participants from the MS (top) and HIV (bottom) cohort. Bias (black line) and 95% CI (red dotted line) are indicated.

