
Fig. 3. Pseudoglands, differential gene expression analysis.
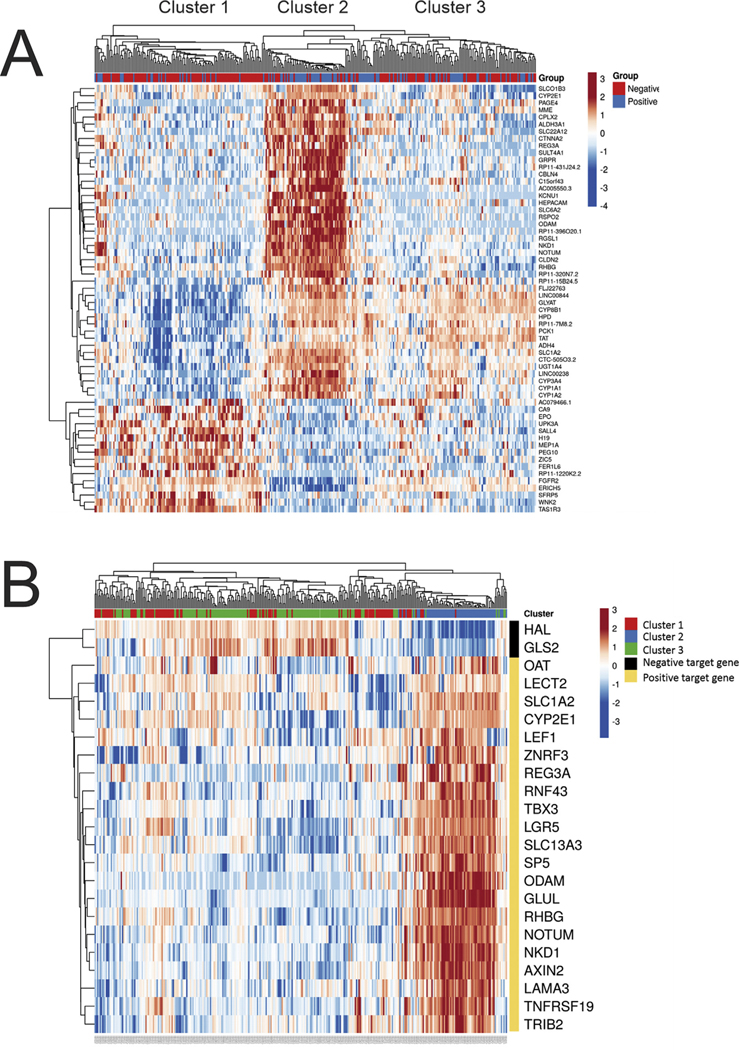
The differentially expressed (DE) genes in HCC with pseudoglands versus without pseudoglands was studied in the entire set of study cases, as well several subsets, which controlled for factors that likely influence pseudogland formation, namely, gender and CTNNB1 mutations. The DE genes identified in each study were then used to classify HCC within the cohort to see if the selected genes accurately predicted pseudogland formation, and the results are shown as heat maps. In the top bar, blue indicates pseudoglands were present, and red indicates their absence. (Panel A) A total of 60 DE genes were identified when examining all cases with sufficient histology and gene expression data (N = 333). When the 60 DE genes were used to classify the HCC, three distinct groups/clusters emerged. (Panel B) These three clusters were then mapped to expression of genes known to be regulated by CTNNB1. Cluster 2, but not clusters 1 and 3, is strongly associated with genes regulated by CTNNB1. (For interpretation of the references to colour in this figure legend, the reader is referred to the Web version of this article.)