
Fig. 4.
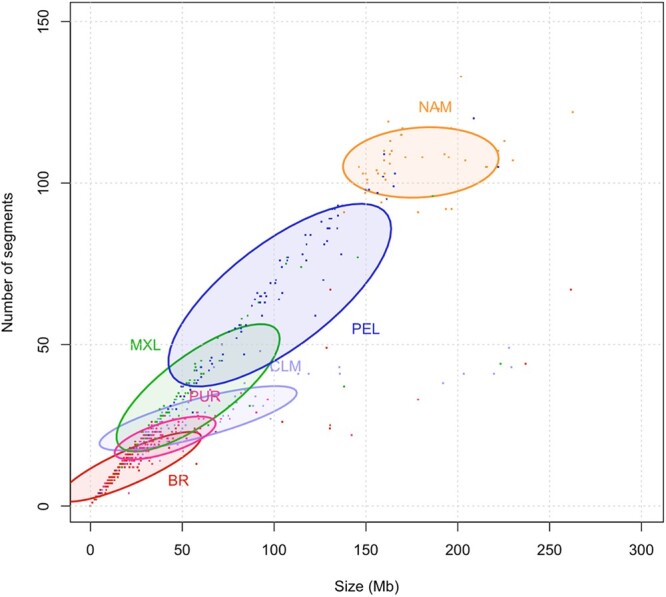
ROH in American populations. The number and the length sum of all ROH segments (Mb) per individual. Ellipses correspond to 50% confidence intervals for each population.
Official websites use .gov
A
.gov website belongs to an official
government organization in the United States.
Secure .gov websites use HTTPS
A lock (
) or https:// means you've safely
connected to the .gov website. Share sensitive
information only on official, secure websites.
ROH in American populations. The number and the length sum of all ROH segments (Mb) per individual. Ellipses correspond to 50% confidence intervals for each population.