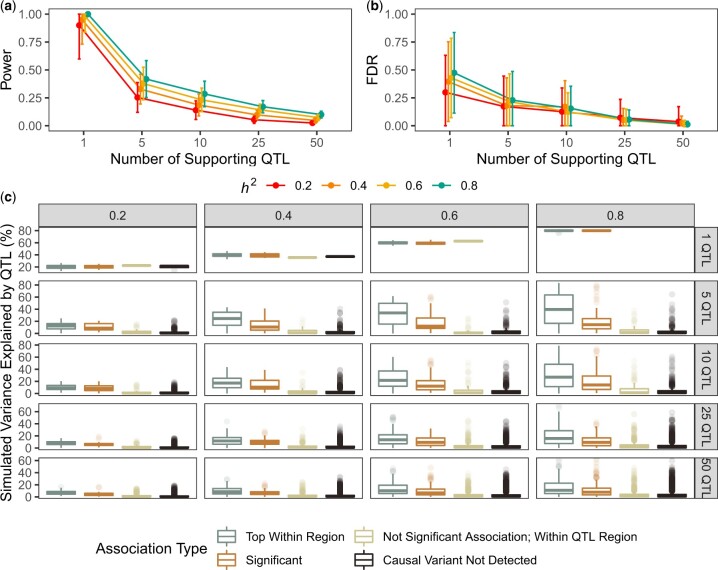
Fig. 2.
Performance benchmarks for GWAS of complex traits. Estimates of power (a) and FDR (b) as a function of the narrow-sense heritability [0.2, 0.4, 0.6, 0.8] and number of causal QTL (ranging from 1 to 50 QTL) underlying quantitative traits (x-axis). c) The empirical phenotypic variance explained by each simulated QTL among all architecture regimes, broken out by whether the causal QTL was the top association within a QTL region of interest, significant (and thereby exceeding the threshold of significance by multiple testing), not a significant association but residing within the QTL region of interest, or outside any region of interest. Lines stretching from each point represent the SD of the performance estimate among all replicate mappings in (a) and (b).

