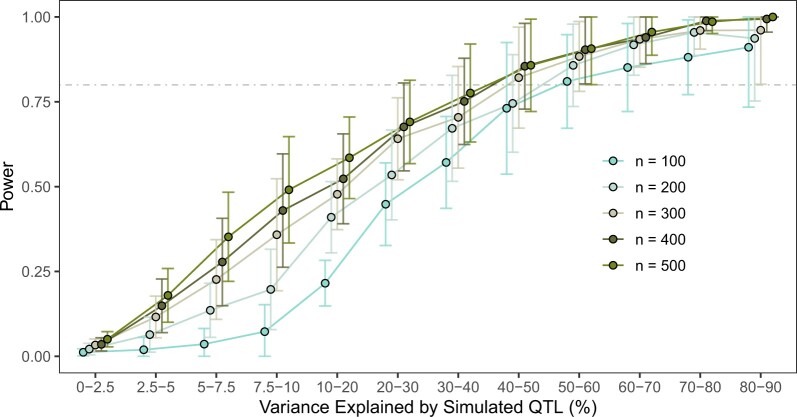
Fig. 3.
Impact of sample size on sensitivity of QTL detection. Power estimates (a) for GWA mappings conditioning on the variance explained by underlying QTL as a function of sample size and strain selection are shown. The corresponding breakdown of the abundance of QTL explaining increasing phenotypic variance (b) and the MAFs (c) of these QTL are shown. Fifty populations at each sample size were subsampled from CeNDR, each undergoing 50 GWAS simulations with h2 = 0.8 and 5 underlying QTL with effects sampled from Gamma (k = 0.4, θ = 1.66).

