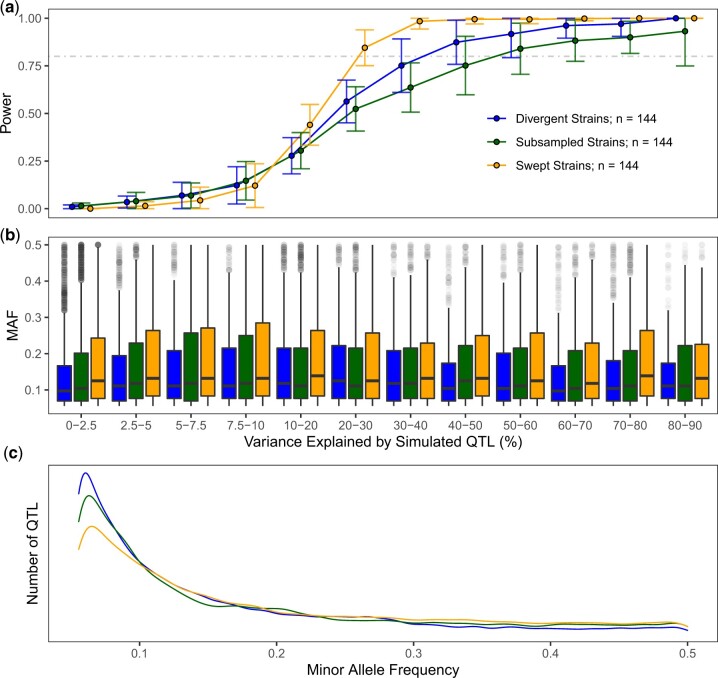
Fig. 4.
Population composition alters performance and underlying distribution of variants. The fraction of simulated QTL detected by GWA (a) and their minor allele frequencies (b) are plotted as a function of the variance they explain and strain selection. c) The underlying distributions of minor allele frequencies and effects of all simulated QTL for each population are displayed. Populations of n = 144 were sampled from swept strains, divergent strains, or the entire CeNDR collection. Traits were simulated with a heritability of 0.8 and 5 underlying QTL effects sampled from Gamma (k = 0.4, θ = 1.66).

