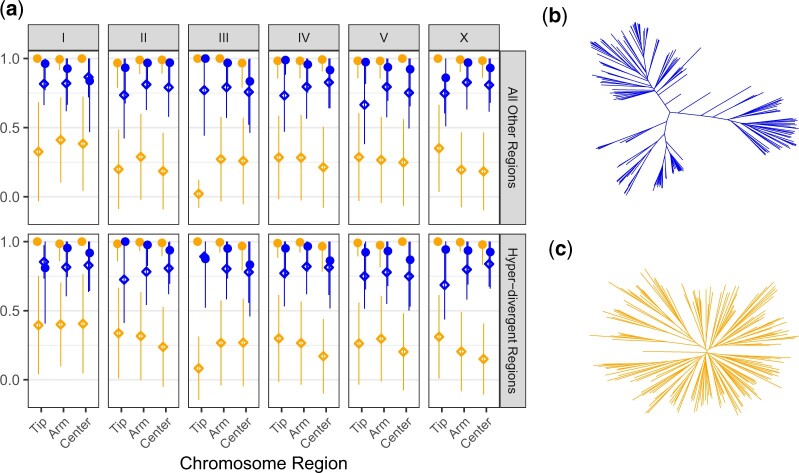
Fig. 5.
Evolutionary history dictates the fine-scale landscape of GWA performance. a) The mean fraction of simulated QTL detected by GWA (circles) and the empirical FDR (diamonds) colored by sample population, each of which were derived of 183 divergent strains (b) or 182 swept strains (c). Facets correspond to different genomic locations where QTL were simulated. Horizontal facets distinguish simulations of QTL within hyper-divergent regions with respect to the N2 reference genome, or within all other loci. Vertical facets delineate subsets of these horizontal facets on each chromosome. Within each block, performance is separated between the low-recombination centers and tips or high-recombination arms of the denoted chromosome.

