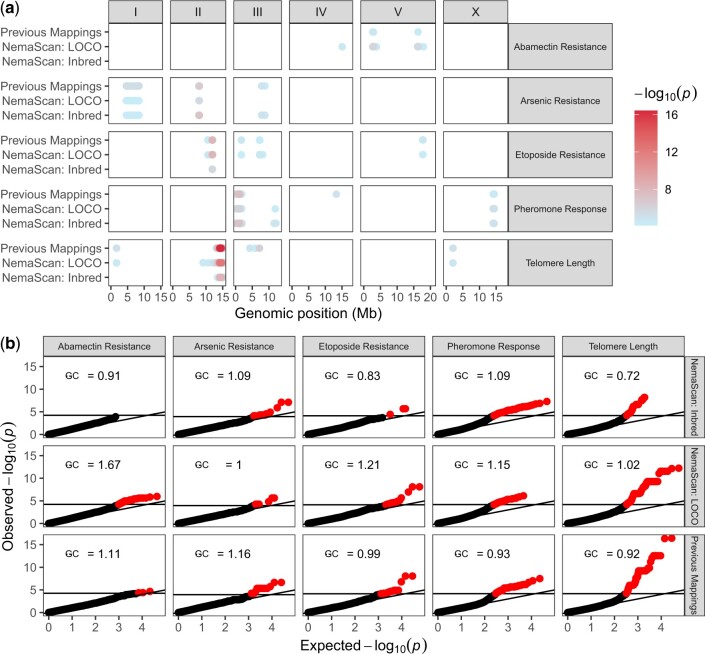
Fig. 6.
GWA mapping with NemaScan recaptures previously validated QTVs. a) Significant genetic associations are shown genome-wide for five quantitative traits that were remapped using the 20210121 CeNDR release both with cegwas2-nf (“Previous Mappings”) and NemaScan, and the strength of the association is displayed in the right-hand panel. b) Quantile-quantile plots of all −log transformed P-values from cegwas2-nf, NemaScan using INBRED kinship matrix construction, and NemaScan using LOCO kinship matrix construction are plotted against their expected rank, with the horizontal line in each panel indicating the trait-specific multiple testing correction significance threshold. Genomic inflation (λGC) calculated from each mapping is displayed in the upper left of each panel.

