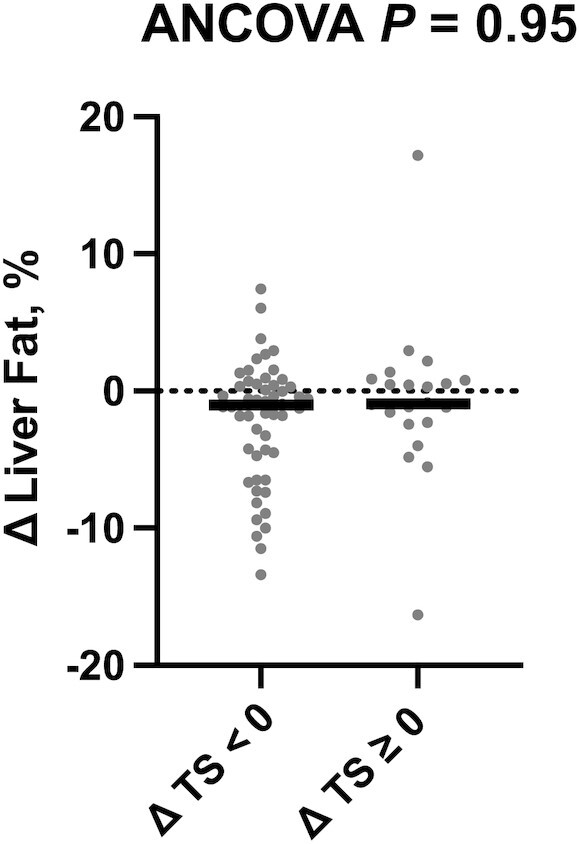
FIGURE 3.

Reduction of TS does not affect liver fat fraction. Changes in liver fat fraction by change in sugar intake group (ΔTS < 0 group, n = 54; ΔTS ≥ 0 group, n = 22). The outcome variable is represented as the change variable calculated as the postintervention value minus the value at baseline. Each participant's change variable is represented by a solid dot. The median is represented by a horizontal bar. The P value for the ANCOVA adjusted for the baseline value of the outcome of interest, sex, and change in physical activity is displayed at the top of the boxplot. TS, total sugar intake.
