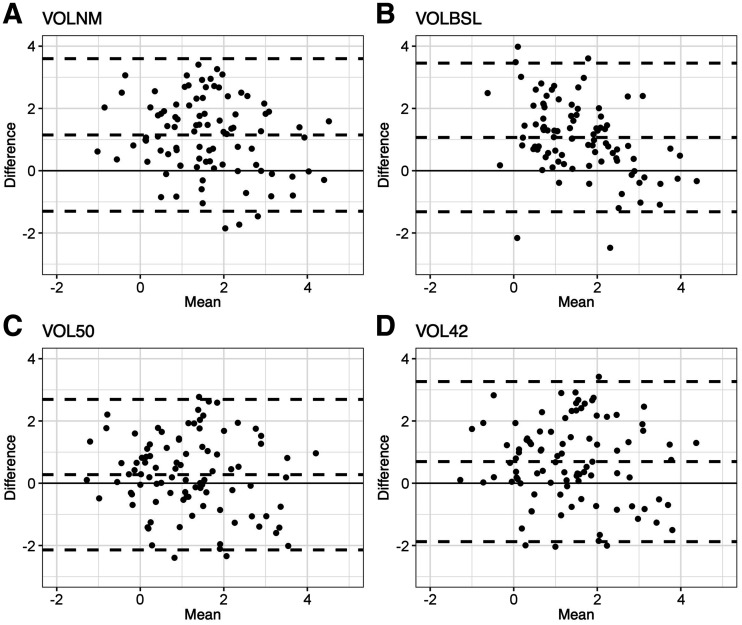
FIGURE 4.
Bland–Altman scatterplots showing relative difference between FTV method as labeled and morphologic volume on y-axis and mean volume of FTV method as labeled and morphologic volume on x-axis. Dashed lines represent upper limits of agreement, lower limits of agreement, and bias (or mean difference). Log transformation was used to correct skewness in distribution of volumes. (A) Manual volume from PET imaging (VOLNM). (B) BSL (VOLBSL). (C) Threshold of 50% relative to SUVmax (VOL50). (D) Threshold of 42% relative to SUVmax (VOL42).

