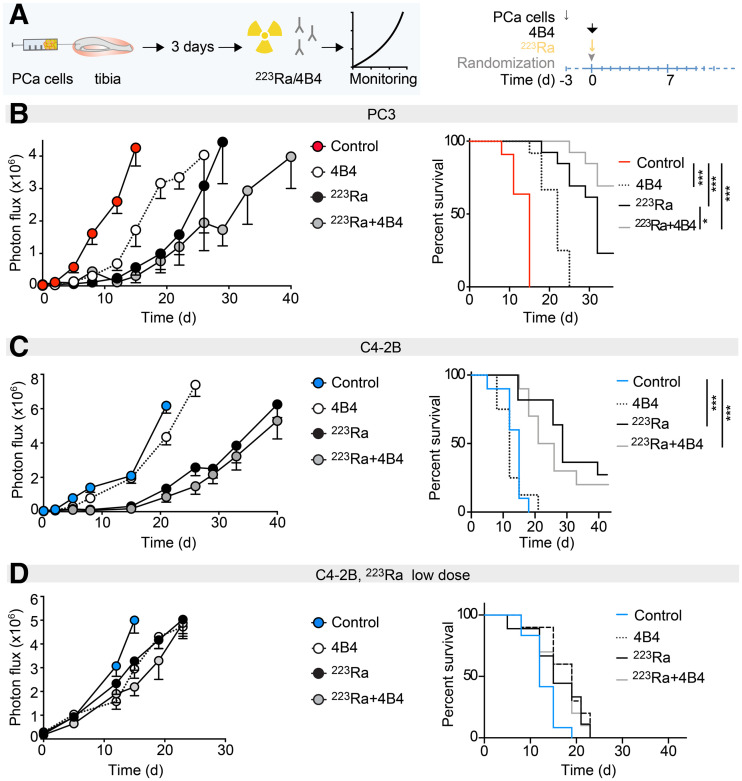
FIGURE 2.
In vivo response of PCa cells in bone to anti-β1I (4B4) and 223Ra treatments. (A) Experimental design and timeline of treatment schedule. (B) PC3 tumors, growth, and survival curve over time (223Ra, 300 kBq/kg; 4B4-mAb, 100 μg/mouse; n = 13–19 tumors). (C and D) C4-2B tumors, growth curve, and survival curve over time (223Ra, 300 kBq/kg; 4B4-mAb, 100 μg/mouse; n = 8–10 tumors [C]; 223Ra, 100 kBq/kg; 4B4-mAb, 100 μg/mouse; n = 9–12 tumors [D]). *P < 0.05. ***P < 0.001, 1-way ANOVA, followed by Tukey honestly-significant-difference post hoc test.

