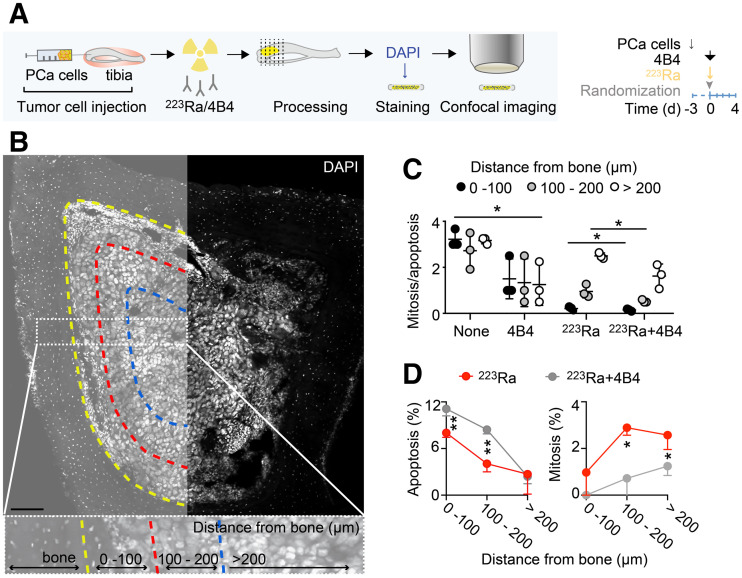
FIGURE 3.
Cellular mechanisms of response to anti-β1I and 223Ra treatments. (A) Cartoon and timeline. (B) Representative overview micrograph. Insert shows zoomed subregions segmented every 100 μm from bone interface. Bar = 100 μm. (C) Quantification of mitosis/apoptosis nucleus ratio for each treatment condition. Data are mean ± SD (n = 3 bones/treatment, 3–5 slices/bone). (D) Zonal comparison of apoptotic and mitotic cells for 223Ra and 223Ra + 4B4 treatments. *P < 0.05. **P < 0.01 by 1-way ANOVA and honestly-significant-difference post hoc test. DAPI = 4′,6-diamidino-2-phenylindole.

