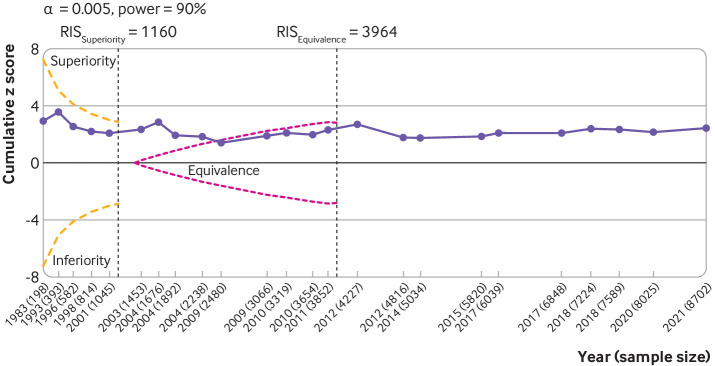
Fig 5.
Trial sequential analysis for pain. Results are based on 24 large, placebo controlled trials (8997 randomised participants). Cumulative z scores were calculated under a random effects model. RIS (required information size; vertical lines) detects a minimal clinically important difference of −0.37 with 90% of power at α level of 0.005. O'Brien-Fleming monitoring boundaries are represented by dashed orange lines. The inner wedges (futility boundaries) are shown in pink and represent limits to the equivalence region considering the 0.2 equivalence margin. Circles denote cumulative z score for each additional trial added to the analysis. Between trial variation was accounted for using diversity (D2) index adjusted sample sizes. A D2 of 50% was assumed. Number of participants analysed (shown by year) might be smaller than number of randomised participants

