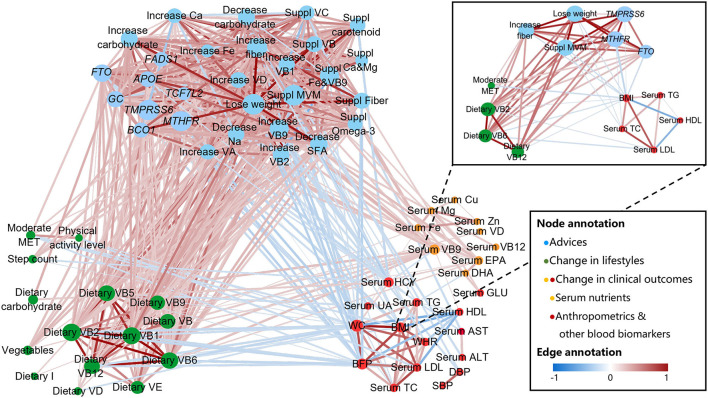
Figure 5.
Longitudinal correlation network of advice, genotype, lifestyles, and clinical outcomes. Connections were calculated by Spearman or Point-Biserial with Benjamini-Hochberg-corrected P < 0.05 and then plotted as a network by Cytoscape. Nodes are colored according to (1) group of advice, including genetic risk notification (e.g., FTO), lifestyle guidance (e.g., lose weight), and nutritional supplements (e.g., Suppl MVM), (2) change in lifestyles (diet and PA), and (3) change in clinical outcomes (anthropometric measurements and blood biomarkers). Node sizes are proportional to betweenness centrality. Edge weights are proportional to the correlation strength, and colors correspond to the direction of association (positive: red; negative: blue). Sub-network in top right shows an example of how “BMI” change be associated with the advice, genotype, lifestyles, and clinical outcomes. ALT, alanine aminotransferase; AST, aspartate aminotransferase; BFP, body fat percentage; BMI, body mass index; Ca, calcium; Cu, copper; DBP, diastolic blood pressure; DHA, docosahexaenoic acid; EPA, eicosapentaenoic acid; Fe, iron; GLU, glucose; HCY, homocysteine; HDL, high density lipoprotein; I, iodine; LDL, low density lipoprotein; MET, metabolic equivalent of task; Mg, magnesium; MVM, multiple vitamin mineral; Na, sodium; SBP, systolic blood pressure; SFA, saturated fatty acid; TC, total cholesterol; TG, triglycerides; UA, uric acid; VA, vitamin A; VB, vitamin B; VC, vitamin C; VD, vitamin D; VE, vitamin E; WC, waist circumference; WHR, waist-to-hip ratio; Zn, zinc.

