

Abstract
This study identifies anatomical and airflow-induced relationships based on nasal morphological variations due to inter- and intra-racial differences and gender. Subject-specific nasal airway reconstruction was created from computed tomography images in 16 subjects: 4 subjects from each ethnic group (Black, East Asian, Caucasian, and Latino) comprising of 2 males and 2 females. Volume, surface area and nasal index were calculated, as well as airflow rate and nasal resistance after computational fluid dynamics simulations in the nasal airway. Results showed that nasal airspace surface area (p=0.0499) and volume (p=0.0281) were significantly greater in males than in females. Nasal volume was greatest in East Asians (Median=20.38cm3, Interquartile Range [IQR]=4.58cm3), Latinos had the greatest surface area (Median=219.70cm2, IQR=29.56cm2). On average, East Asian and Black females had larger nasal index than their male counterparts. Caucasians had the highest median nasal resistance (0.050Pa.s/ml, IQR=0.025Pa.s/ml). Results indicate that there exist anatomical variabilities based on race and gender. However, these variabilities may not significantly influence nasal function.
Keywords: Gender, Nasal Anatomical Variation, Computational Analysis, Race, Respiratory Physiology
Introduction
The normal human nose is distinguished by common inter- and intra-individual nasal morphological variations. These variations such as nasal cycle, nasal vestibule phenotypes, and nasal index can influence objective description of normal nasal airflow profile.1–6 In brief, the asymmetry of nasal airflow as characterized by a random, reciprocal shift in nasal patency due to temporal periods of congestion and decongestion of the mucosa in both nasal passages is described as nasal cycle.1 The typical duration of time that one cycle last is between 30 minutes and 6 hours.7 Prior studies reported that between 21% and 80% of individuals experience some aspect of nasal cycling.4, 8, 9
Ramprasad and Frank-Ito 10 identified another feature of natural variation in the nasal anatomy based on nasal vestibule morphological shapes, which were classified as Notched, Standard, and Elongated. Reported findings suggest that global airflow patterns and resistance in the nasal cavity were unaffected by the different morphological shapes, but local airflow resistance and air conditioning performance were found to be greatly impacted by these morphological variations.4, 10, 11 Consequently, it was postulated that the manifestation of these distinct normal nasal vestibule phenotypes may be associated with the fact that the human nasal airway naturally response to localized constrictions by inducing corresponding physiological response on other regions of the airway in order to maintain natural ventilation conditions.4, 10–13
Variations in nasal morphology is also thought to have been due to human adaptation to diverse climatic environments.3, 14–18 Changes in nasal shape reflect the conditions for respiration in an environment as adaptations were made in order to provide more efficient conditions to maximize respiration.3, 14, 19 These differences in human noses due to geographic adaptations are often characterized by nasal index.10, 20–22 Nasal index is defined as the ratio between the width and height of the anterior nose.10, 23 A systematic review study performed by Leong and Eccles showed no consistent evidence in the literature to support the idea that differences in nasal shape and size based on ethnic descent influence physiology.20
Although the predicted link between race and nasal morphology is supported by anthropological studies recording relationships between climate and nasal function, more studies need to be done to understand how gender differences within and between races influence nasal physiology. Very little is known on the associations of nasal anatomy and function based on race and gender. Nonetheless, it has been established that males exhibit larger nasal cavities volumes and longer and narrower nasal floors than females of a similar body size.5, 24–27 In addition, males have larger lungs, generally larger chest walls, and longer diaphragms than females.5
In view of what is currently known, the purpose of the present study is to use computational modeling to investigate additional relationships between nasal morphological variations due to inter- and intra-racial differences and gender.
Method
Selection of Study Cohort
This is a retrospective study approved by the Duke University Health System Institutional Review Board for Clinical Investigations. Sixteen adult subjects with high resolution computed tomography (CT) images were selected based on a search of Duke University Medical records. The subjects are from four racial/ethnic groups: African Americans (Blacks); East Asians; Caucasians; and Latin Americans. Furthermore, the study cohort is made up of eight males and eight females, four subjects from each racial/ethnic group comprising of two males and two females. Inclusion criteria were normal nasal anatomy; high resolution spiral CT scan images; and no clinical evidence of nasal and/or sinonasal disease. CT images were examined by a Duke University attending radiologist and an otolaryngologist to ensure that the nasal cavities of all subjects selected for this work had radiographic evidence of normal nasal cavity.
Nasal Reconstruction and Mesh Generation
DICOM images of each subject were de-identified and imported into the imaging analysis and segmentation software, Avizo Lite 2019.3 (Thermo Fisher Scientific, Waltham, Massachusetts). Three-dimensional (3D) reconstructions of each subject’s main nasal passage were digitally created, and the paranasal sinuses excluded since this study focuses on the main nasal cavity. Avizo Lite 2019.3 was also used to calculate the volume (V) and surface area (SA) of each subject’s nasal passage. The nasopharynx was excluded from these calculations as it has been reported that perception of nasal patency during respiration was more evident from nostrils to choana than nostrils to posterior end of nasopharynx.28 The surface area-to-volume ratio (SAV) was calculated by dividing the SA by the V.
Next, each reconstructed model was exported in stereolithography file format from Avizo and into the CAD and mesh generating software package, ICEM-CFD 19.0 (ANSYS, Canonsburg, PA). To highlight inlet and outlet flow, an inlet box covering the external nose and an outlet surface at the nasopharynx were created. Following the creation of these regions, roughly 4 million unstructured tetrahedral elements and fine three-layer prism elements were generated in each model’s computational domain. Mesh refinement analysis was not done based on prior work based on prior work by our group.29 Mesh quality analysis was performed to confirm that the aspect ratio for the hybrid mesh was properly smoothed to prevent poor elements quality from impacting the accuracy of the numerical simulation.
Numerical Simulation
Steady-state, laminar inspiratory airflow was simulated in the nasal cavities using the CFD software package Fluent 19.0 (ANSYS, Inc., Canonsburg, PA) to mimic physiologic inhalation conditions at 15L/min. The no-slip, stationary wall boundary condition was imposed on the nasal wall. A “pressure-inlet” condition at the created inlet box with gauge pressure set to zero. A “mass-flow-rate” condition at the outlet (inferior end of nasopharynx) to target 0.000301kg/s (15L/min).
Computed Quantities of Interest
To determine the patency of each nasal cavity, nasal resistance (NR) was calculated as ΔP⁄Q (Pa.s/mL) where ΔP is bilateral pressure drop from nostrils to choana, and Q is bilateral volumetric flow rate. In addition, nasal index was calculated as where is the nasal width and is the nasal height as described in Patki and Frank-Ito 3 (Figure 1). Lastly, statistical comparisons were made between the genders using the nonparametric Wilcoxon Rank Sum test, and significance was assessed at alpha=0.05 that the difference in their median values is zero.
Figure 1:

Frontal and side views of the external nose by race and gender showing visual description of the nasal width (NW) and nasal height (NH). EAF=East Asian Female; EAM=East Asian Male; BF=Black Female; BM=Black Male; LF=Latino Female; LM=Latino Male; CF=Caucasian Female; CM=Caucasian Male.
Results
Comparison of Surface Area, Volume, and Surface Area-to-Volume Ratio
Boxplots of bilaterally computed nasal airspace surface area (SA), volume (V), and surface area-to-volume ratio (SAV) were compared across East Asians, Blacks, Latinos, Caucasians; and between genders (males and females). Across the races (Figure 2A), median (IQR=interquartile range) SA was greatest among Latinos at 266.02cm2 (IQR=25.03cm2), while East Asians had the smallest median (IQR) SA at 187.50cm2 (IQR=23.33cm2). The median (IQR) SA comparison by gender presented in Figure 2B showed that males had a significantly greater (p= 0.0499) SA than females; 218.83cm2 (IQR=29.42cm2) versus 190.08cm2 (IQR=19.77cm2).
Figure 2:
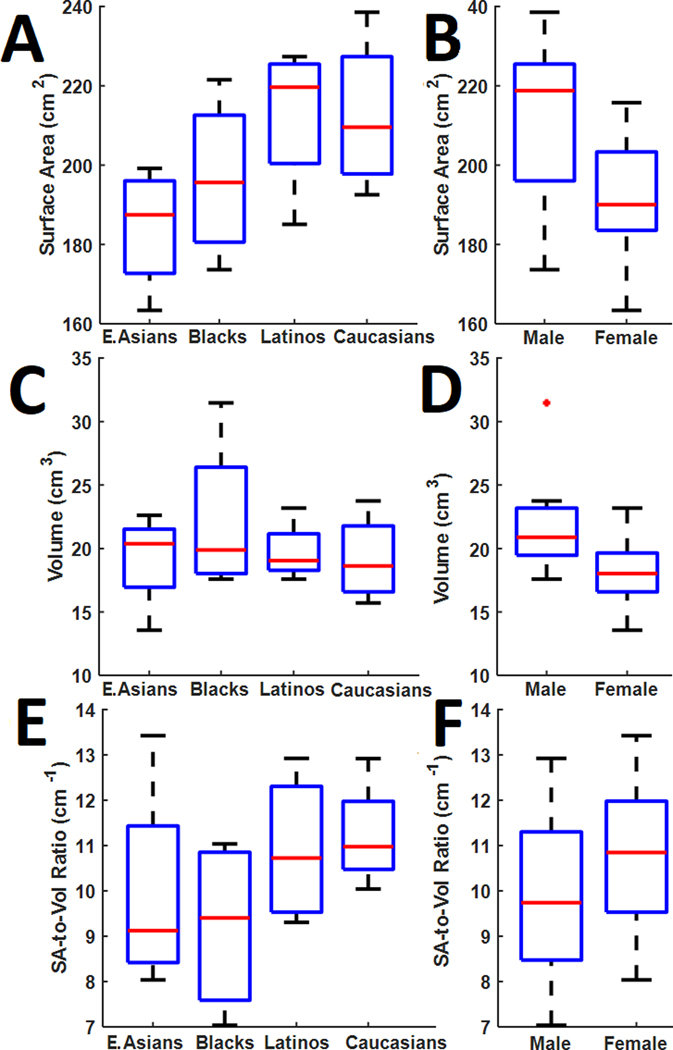
Nasal cavity surface area by (A) Race and (B) Gender. Nasal cavity volume by (C) Race and (D) Gender. Nasal cavity surface area-to-volume ratio by (E) Race and (F) Gender.
With regards to nasal airway volume, East Asians and Caucasians had the largest and smallest median (IQR) volume, respectively; 20.38cm3 (IQR=4.58cm3) for East Asians and 18.63cm3 (IQR=5.19cm3) for Caucasians (Figure 2C). Interestingly, as evidenced by IQR values and whisker lengths in Figure 2C, Blacks demonstrated the largest variability (IQR=8.38cm3) in the distribution of nasal cavity volume. Similar to Figure 2B, box plots in Figure 2D showed that males had a significantly larger (p = 0.0281) distribution of nasal cavity volume than females; 20.88cm3 (IQR=3.72cm3) versus 18.02cm3 (IQR=3.06cm3).
The median (IQR) SAV for all four racial groups indicated (Figure 2E) that Caucasians and Latinos had relatively larger SAV at 10.97cm−1 (IQR=1.50cm−1) and 10.72cm−1 (IQR=2.77cm−1), respectively, compared to the respective median (IQR) SAV for East Asians and Blacks; 9.12cm−1 (IQR=3.01cm−1) and 9.40cm−1 (IQR=3.26cm−1). Figure 2F showed that females had a slightly larger median (IQR) SAV than males at 10.85cm−1 (IQR=2.44cm−1) and 9.74cm−1 (IQR=2.82cm−1), respectively, albeit not significantly larger than males (p=0.44).
On average, nasal cavity SA for the females in each race/ethnicity was smaller than their respective males’ counterparts (Figure 3A); however, average SA for Black females (195.67cm2) was marginally smaller than Black males (197.60cm2). With a difference of 29.56cm2, the Caucasian race had the largest difference between average SA for females and males. The group with the smallest average SA across all races and genders was East Asian females at 172.74cm2, while the largest average SA was Caucasian males at 227.36cm2.
Figure 3:
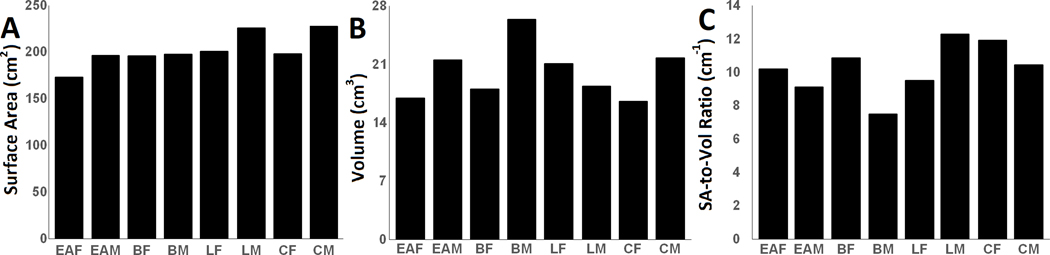
Nasal cavity quantification by race and gender for (A) Surface area, (B) Volume, and (C) Surface Area-to-Volume Ratio.
Average volume of the nasal cavity (Figure 3B) largely followed similar pattern as SA (Figure 3A), with exception of Latinos where Latino females had larger average nasal V than their male counterpart at 21.07cm3 and 18.34cm3, respectively. Overall, Caucasian females had the smallest average nasal cavity volume at 16.58cm3, while Black males had the largest at 26.40cm3 (Figure 3B). Results for SAV were completely reversed from those of nasal volume – except for Latinos, average SAV values among females of the other races/ethnicities were respectively larger than their male counterparts (Figure 3C). Caucasian females and Latino males overall had the largest SAV at 11.93cm−1 and 12.28cm−1, while Black males had the smallest at 7.48 cm-1.
Comparisons of Nasal Index
Nasal index in Figure 4A revealed that Blacks had the largest median nasal index of 95.82(IQR=3.08), whereas Caucasians had the smallest median nasal index of 72.46 (IQR=0.89). Latinos and East Asians followed with a median of 82.59(IQR=8.84) and 78.33 (IQR=6.62), respectively. In Figure 4B, males had a slightly larger nasal index than females with respective median values of 80.98 (IQR=13.86) and 79.25 (IQR=20.12).
Figure 4:
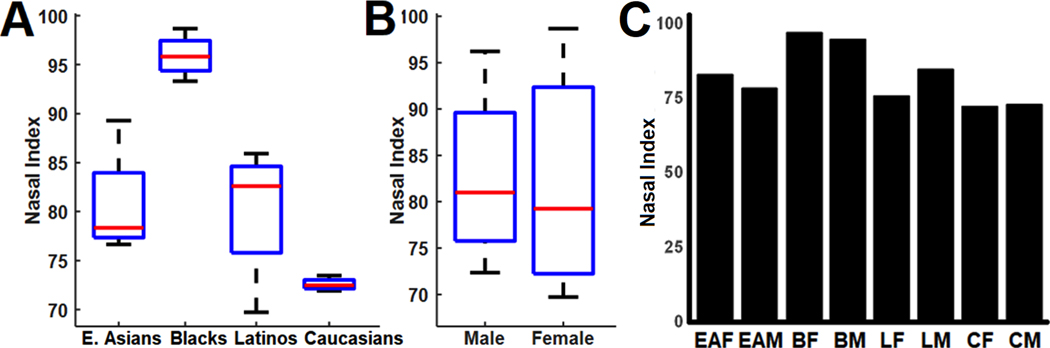
Nasal index quantification by (A) Race, (B) Gender, and (C) Race and gender.
Figure 4C described comparisons between race and gender for nasal index, East Asian and Black females had larger average nasal index than their male counterparts, while Latino and Caucasian males had larger average nasal index than their female counterparts. It should be noted that the difference in average nasal index between Caucasian males and females may be consider negligible. Overall, black females had the largest average NI at 97.05 and Caucasian females had the smallest average nasal index at 72.24.
Comparisons of Airflow and Resistance
Bilaterally computed nasal airflow-related variables (pressure, nasal resistance) were compared across all four races/ethnicities and between genders (Figure 5). Among the races, Caucasians had the greatest median nasal airflow pressure of 12.55Pa (IQR=6.19Pa), followed by Blacks at 11.47Pa (IQR=7.79Pa); while East Asians had the smallest median nasal airflow pressure of 5.65Pa (IQR=7.45Pa; Figure 5A). For nasal airflow pressure comparison by gender, males and females had approximately the same median nasal airflow pressure values (males=10.88Pa, females, 10.11Pa, p= 0.7984); nonetheless, males had larger variability with an IQR of 9.21Pa, compared to females (IQR = 5.14Pa; Figure 5B).
Figure 5:

Nasal pressure by (A) Race and (B) Gender. Nasal resistance by (C) Race and (D) Gender.
Median nasal resistance was highest among Caucasians at 0.050Pa.s/ml (IQR=0.025Pa.s/ml; Figure 5C). Blacks and Latinos followed with nearly identical median nasal resistance of 0.046Pa.s/ml (IQR=0.032Pa.s/ml) and 0.043Pa.s/ml (IQR=0.016Pa.s/ml), respectively. East Asians had the lowest nasal resistance (median= 0.023Pa.s/ml, IQR=0.030Pa.s/ml). Next, nasal resistance between males and females were not significant difference (p= 0.7984). Both genders had nearly identical median nasal resistance values of 0.044Pa.s/ml (IQR= 0.04Pa.s/ml) for males and 0.041Pa.s/ml (IQR= 0.02Pa.s/ml) for females (Figure 5D).
Additionally, average pressure for males was larger than females of their respective race in all races except for East Asians (Figure 6A). Caucasian and East Asian females had very similar pressure values around 12.50Pa. East Asian females had a much greater pressure than East Asian males with a difference of 6.95Pa. Across all races and genders, Black males had the largest pressure at 14.65Pa, while East Asian males had the smallest pressure at 5.64Pa.
Figure 6:
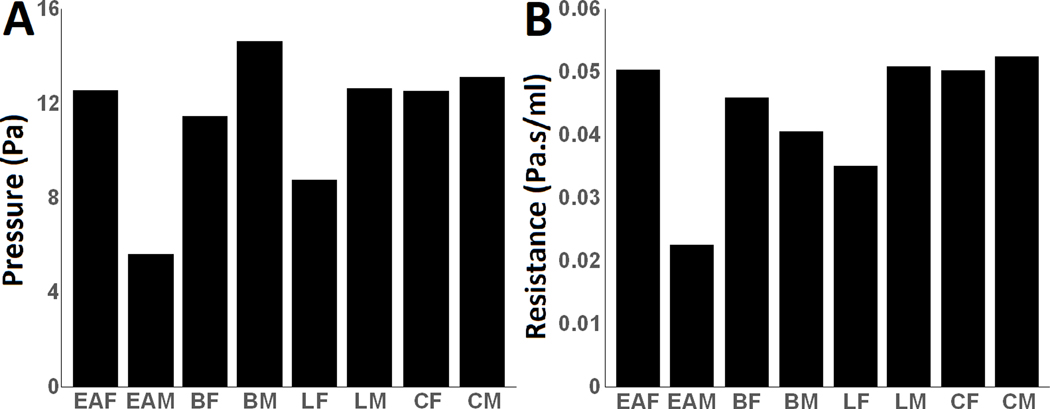
Nasal cavity results by race and gender for (A) Pressure, and (B) Resistance
Similar to Figure 5, Figure 6 revealed that nasal airflow pressure and nasal resistance generally followed identical patterns, except among Blacks where females on average had lower nasal airflow pressure (Figure 6A) but higher nasal resistance (Figure 6B) than their male counterparts. Latino males, East Asian females, and both Caucasian genders had nearly similar nasal airflow pressure of about 13 Pa (Figure 6A), and nasal resistance value around 0.05Pa.s/ml (Figure 6B). Across all races and genders, Caucasian males had the largest nasal resistance at 0.052Pa.s/ml and East Asian males had the smallest nasal resistance at 0.023Pa.s/ml (Figure 6B). Lastly, Figure 7 shows nasal airflow streamlines in the computational domain of all 16 subjects. A total of 100 equally spaced streamlines were released from the inlet box and streamlines were colored by velocity magnitude.
Figure 7:

Nasal airflow streamlines in the computational domain of all 16 subjects colored by velocity magnitude.
Discussion
The present study focused on relationships between nasal morphological variations due to inter- and intra-racial differences and gender, which differs from previously published studies investigating nasal morphological variations.3, 30 Unlike this study that categorizes nasal index by subjects’ race/ethnicity with gender, and gender separately; Patki and Frank-Ito 3 and Calmet et al. 31 explored the relationship between nasal index and CFD simulated airflow-related variables, such as nasal resistance, wall shear stress, and heat flux.
Although Keeler et al. 30 modeled deposition patterns of individuals across the same four race/ethnic groups as the present study, as well as briefly reported results of SAV ratio, nasal resistance and nasal index across races/ethnicities; the present student conducted an in-depth analysis of both anatomical and airflow-related variables in the same race/ethnic groups with gender as a factor. In addition, Keeler et al. 30 included the nasal and paranasal sinuses of each subject in their CFD models while the present study excluded the paranasal sinuses are they have negligible effects on physiological functions pertaining to the main nasal cavities.
The nasal index results computed in the present study are in agreement with reports on climate-related variation in human nose, suggesting that individuals that evolved from colder and drier climates (such as Caucasians) tended to have smaller nasal index than individuals from warmer and more humid climates (such as Blacks).3, 20, 30, 32, 33 While this study did not directly compare nasal index to the SA and V, the results of the study conducted by Yokley16 appear to show no significant trend between the variables. He reported no strong reflection between the nasal index and the SAV ratio of the nasal passages under either normal or decongested conditions. This implies that there may not be strong evidence showing that the size and shape of the exterior nose effects internal nasal physiology.3
Results in the present study pertaining to nasal index and gender are consistent with those previously reported by Ravichandran et al. 34 In their paper, Ravichandran and colleagues found that nasal index is a reliable parameter for the estimation of gender difference, noting that the average value of nasal indices of South Indian males was greater than South Indian females.34 Additionally, in a study examining the nasal index of the Kosovo Albanian population, males had a significantly higher nasal index than females (p < 0.001).35 While similar conclusions can be made with the Caucasian population from the present study, it should be noted that the difference in median nasal index between Caucasian males and females was 0.66. Additionally, when comparing nasal index and gender by race, East Asian and Black females had larger average nasal index than their male counterparts.
The current literature is sparse regarding the relationship between nasal resistance and race/ethnicity. Keeler et al. 30 reported that average nasal resistance for African Americans and Caucasians were lowest and highest, respectively. Furthermore, other studies have reported no significant differences in nasal resistance between African descents and Caucasians.32, 36, 37 Babatola measured nasal resistance of African descents from Nigeria and concluded that nasal resistance in this population was similar to those of Caucasians and Asians.36 Calhoun et al. and Ohki et al.32, 37 also arrived at similar conclusions in their studies; indicating that nasal resistance was not significantly different among Caucasians, East Asians, and Blacks. Results from the present study suggest that median nasal resistance was highest among Caucasians, followed by Blacks before Latinos, and East Asians had the lowest median nasal resistance values. Nonetheless, it should be noted that the IQR values for Blacks and East Asians were particularly larger than those of Caucasians and Latinos, implying there could be possible overlap among the groups, which may indicate non-significant differences among groups.
In addition, the present study indicates that females have a larger nasal resistance than males. More specifically, when comparing between nasal resistance and race and gender, this trend was seen within every race except for Caucasians. A study conducted by Warren et al.38 and Hazeri et al. 22 revealed no significant difference in resistances for males and females with normal nasal anatomy. However, a study that measured nasal resistance in a healthy population in China found the mean total nasal resistance in males significantly lower compared to females.39
The main limitation from the present study pertains to our relatively small sample size. Although there were 16 subjects, each race had 4 subjects, and after further stratification by race and gender, there were 2 subjects per group. In conclusion, this study investigated the relationships between normal nasal morphological variations due to inter- and intra-racial and gender differences in subject-specific nasal airway models from 16 subjects across 4 racial groups. Variables, such as nasal surface area, volume, nasal index, airflow rate, and nasal resistance were computed. Findings from the present work indicate that there is an association between normal nasal anatomical variabilities across race and gender. However, these variabilities may not discriminate proper functioning of the nasal cavity across race and gender.
Highlights.
This study investigates how normal nasal morphological variations due to race and gender differences influence nasal respiratory physiology.
The findings suggest that surface area and volume of the male nasal cavity were significantly larger than females.
On average, East Asian and Black females demonstrated larger nasal indices than males; the reverse was seen for Latinos and Caucasians
Median resistance was highest among Caucasians and lowest among East Asians, albeit the result does not suggest significant differences in nasal resistance across racial groups.
Acknowledgement
Research reported in this publication was supported by the National Institute of Dental & Craniofacial Research of the National Institutes of Health under Award Number R01DE028554. The content is solely the responsibility of the authors and does not necessarily represent the official views of the National Institutes of Health. In addition, special thanks to ANSYS, ANSYS Global Academic Program, and Dr. Paolo Maccarini (Duke University), for support and strategic donation. All authors gave final approval for publication.
Financial Disclosure Statement:
This research was supported by the National Institute of Dental & Craniofacial Research of the National Institutes of Health under Award Number R01DE028554.
Ethics Approval:
This study was approved by DUHS Institutional Review Board under protocol Pro00102005.
Footnotes
Conflicts of interest: The authors have no conflicts of interest to disclose.
References
- 1.Eccles R. A role for the nasal cycle in respiratory defence. Eur Respir J. Feb 1996;9(2):371–6. doi: 10.1183/09031936.96.09020371 [DOI] [PubMed] [Google Scholar]
- 2.Sicard RM, Frank-Ito DO. Role of nasal vestibule morphological variations on olfactory airflow dynamics. Clinical Biomechanics. 2021;82:105282. [DOI] [PMC free article] [PubMed] [Google Scholar]
- 3.Patki A, Frank-Ito DO. Characterizing human nasal airflow physiologic variables by nasal index. Respiratory physiology & neurobiology. 2016;232:66–74. [DOI] [PubMed] [Google Scholar]
- 4.Frank-Ito DO, Garcia G. Clinical Implications of Nasal Airflow Simulations. Clinical and Biomedical Engineering in the Human Nose. Springer; 2020:157–192. [Google Scholar]
- 5.LoMauro A, Aliverti A. Sex differences in respiratory function. Breathe. 2018;14(2):131–140. doi: 10.1183/20734735.000318 [DOI] [PMC free article] [PubMed] [Google Scholar]
- 6.Inthavong K, Das P, Singh N, Sznitman J. In silico approaches to respiratory nasal flows: A review. Journal of biomechanics. 2019;97:109434. [DOI] [PubMed] [Google Scholar]
- 7.Gungor A, Moinuddin R, Nelson RH, Corey JP. Detection of the nasal cycle with acoustic rhinometry: techniques and applications. Otolaryngology—Head and Neck Surgery. 1999;120(2):238–247. [DOI] [PubMed] [Google Scholar]
- 8.Moinuddin R, Mamikoglu B, Barkatullah S, Corey JP. Detection of the nasal cycle. American journal of rhinology. 2001;15(1):35–40. [DOI] [PubMed] [Google Scholar]
- 9.Flanagan P, Eccles R. Spontaneous changes of unilateral nasal airflow in man. A re-examination of the ‘nasal cycle’. Acta oto-laryngologica. 1997;117(4):590–595. [DOI] [PubMed] [Google Scholar]
- 10.Ramprasad VH, Frank-Ito DO. A computational analysis of nasal vestibule morphologic variabilities on nasal function. Journal of biomechanics. 2016;49(3):450–457. [DOI] [PubMed] [Google Scholar]
- 11.Dong J, Ma J, Shang Y, Inthavong K, Qiu D, Tu J, Frank-Ito D. Detailed nanoparticle exposure analysis among human nasal cavities with distinct vestibule phenotypes. Journal of Aerosol Science. 2018;121:54–65. [Google Scholar]
- 12.Berger G, Hammel I, Berger R, Avraham S, Ophir D. Histopathology of the inferior turbinate with compensatory hypertrophy in patients with deviated nasal septum. The laryngoscope. 2000;110(12):2100–2105. [DOI] [PubMed] [Google Scholar]
- 13.Inthavong K, Ma J, Shang Y, Dong J, Chetty AS, Tu J, Frank-Ito D. Geometry and airflow dynamics analysis in the nasal cavity during inhalation. Clinical Biomechanics. 2019;66:97–106. [DOI] [PubMed] [Google Scholar]
- 14.Noback ML, Harvati K, Spoor F. Climate‐related variation of the human nasal cavity. American journal of physical anthropology. 2011;145(4):599–614. [DOI] [PubMed] [Google Scholar]
- 15.Weiner JS. Nose shape and climate. American Journal of Physical Anthropology. 1954;12(4):615–618. [DOI] [PubMed] [Google Scholar]
- 16.Yokley TR. Ecogeographic variation in human nasal passages. American Journal of Physical Anthropology: The Official Publication of the American Association of Physical Anthropologists. 2009;138(1):11–22. [DOI] [PubMed] [Google Scholar]
- 17.Maddux SD, Butaric LN, Yokley TR, Franciscus RG. Ecogeographic variation across morphofunctional units of the human nose. American journal of physical anthropology. 2017;162(1):103–119. [DOI] [PubMed] [Google Scholar]
- 18.Evteev AA, Grosheva AN. Nasal cavity and maxillary sinuses form variation among modern humans of Asian descent. American journal of physical anthropology. 2019;169(3):513–525. [DOI] [PubMed] [Google Scholar]
- 19.Wroe S, Parr WC, Ledogar JA, Bourke J, Evans SP, Fiorenza L, Benazzi S, Hublin J-J, Stringer C, Kullmer O. Computer simulations show that Neanderthal facial morphology represents adaptation to cold and high energy demands, but not heavy biting. Proceedings of the Royal Society B: Biological Sciences. 2018;285(1876):20180085. [DOI] [PMC free article] [PubMed] [Google Scholar]
- 20.Leong SC, Eccles R. A systematic review of the nasal index and the significance of the shape and size of the nose in rhinology. Clinical Otolaryngology. 2009;34(3):191–198. [DOI] [PubMed] [Google Scholar]
- 21.Thomson A, Buxton LD. Man’s nasal index in relation to certain climatic conditions. Journal of the Anthropological Institute of Great Britain and Ireland. 1923:92–122. [Google Scholar]
- 22.Hazeri M, Farshidfar Z, Faramarzi M, Sadrizadeh S, Abouali O. Details of the physiology of the aerodynamic and heat and moisture transfer in the normal nasal cavity. Respiratory physiology & neurobiology. 2020;280:103480. [DOI] [PubMed] [Google Scholar]
- 23.Davies A. A re-survey of the morphology of the nose in relation to climate. The Journal of the Royal Anthropological Institute of Great Britain and Ireland. 1932;62:337–359. [Google Scholar]
- 24.Brooks LJ, Strohl KP. Size and mechanical properties of the pharynx in healthy men and women. American Review of Respiratory Disease. 1992;146(6):1394–1397. [DOI] [PubMed] [Google Scholar]
- 25.Huang D-YW, Zhang Peng-Chi, Dong Fang, Yeoh Kian-Hian, Zhi-Li. Evaluation of nasal cavity by acoustic rhinometry in Chinese, Malay and Indian ethnic groups. Acta oto-laryngologica. 2001;121(7):844–848. [DOI] [PubMed] [Google Scholar]
- 26.Inthavong K, Tian Z, Li H, Tu J, Yang W, Xue C, Li CG. A numerical study of spray particle deposition in a human nasal cavity. Aerosol Science and Technology. 2006;40(11):1034–1045. [Google Scholar]
- 27.Heuzé Y. What does nasal cavity size tell us about functional nasal airways? Bulletins et Mémoires de la Société d’Anthropologie de Paris. 2019;31(1–2):69–76. [Google Scholar]
- 28.Kim SK, Heo GE, Seo A, Na Y, Chung S-K. Correlation between nasal airflow characteristics and clinical relevance of nasal septal deviation to nasal airway obstruction. Respiratory physiology & neurobiology. 2014;192:95–101. [DOI] [PubMed] [Google Scholar]
- 29.Frank-Ito DO, Wofford M, Schroeter JD, Kimbell JS. Influence of Mesh Density on Airflow and Particle Deposition in Sinonasal Airway Modeling. J Aerosol Med Pulm Drug Deliv. Jun 11 2015;doi: 10.1089/jamp.2014.1188 [DOI] [PMC free article] [PubMed] [Google Scholar]
- 30.Keeler JA, Patki A, Woodard CR, Frank-Ito DO. A Computational Study of Nasal Spray Deposition Pattern in Four Ethnic Groups. J Aerosol Med Pulm Drug Deliv. Apr 2016;29(2):153–66. doi: 10.1089/jamp.2014.1205 [DOI] [PMC free article] [PubMed] [Google Scholar]
- 31.Calmet H, Kleinstreuer C, Houzeaux G, Kolanjiyil AV, Lehmkuhl O, Olivares E, Vázquez M. Subject-variability effects on micron particle deposition in human nasal cavities. Journal of Aerosol Science. 2018;115:12–28. [Google Scholar]
- 32.Ohki M, Naito K, Cole P. Dimensions and resistances of the human nose: racial differences. The Laryngoscope. 1991;101(3):276–278. [DOI] [PubMed] [Google Scholar]
- 33.Romo Iii T, Abraham MT. The ethnic nose. Facial plastic surgery. 2003;19(03):269–278. [DOI] [PubMed] [Google Scholar]
- 34.Ravichandran S, Yuvraj Babu K, Mohanraj KG. Correlation of facial and nasal index in gender determination. Drug Invention Today. 2018;10(12) [Google Scholar]
- 35.Staka G, Dragidella F, Disha M. Anthropometric study of nasal index of the Kosovo Albanian population. Antrocom Online Journal of Anthropology. 2012;8(2):457–462. [Google Scholar]
- 36.Babatola F. Nasal resistance values in the adult Negroid Nigerian. Rhinology. 1990;28(4):269–273. [PubMed] [Google Scholar]
- 37.Calhoun KH, House W, Hokanson JA, Quinn FB. Normal nasal airway resistance in noses of different sizes and shapes. Otolaryngology—Head and Neck Surgery. 1990;103(4):605–609. [DOI] [PubMed] [Google Scholar]
- 38.Warren DW, Duany LF, Fischer ND. Nasal pathway resistance in normal and cleft lip and palate subjects. The Cleft palate journal. 1969;6(2):134–140. [PubMed] [Google Scholar]
- 39.Ren L, Zhang L, Duan S, Zhang W, Zhang Y. Nasal airflow resistance measured by rhinomanometry in a healthy population of China. Wiley Online Library; 2018:1308–1314. [DOI] [PubMed] [Google Scholar]