Figure 1.
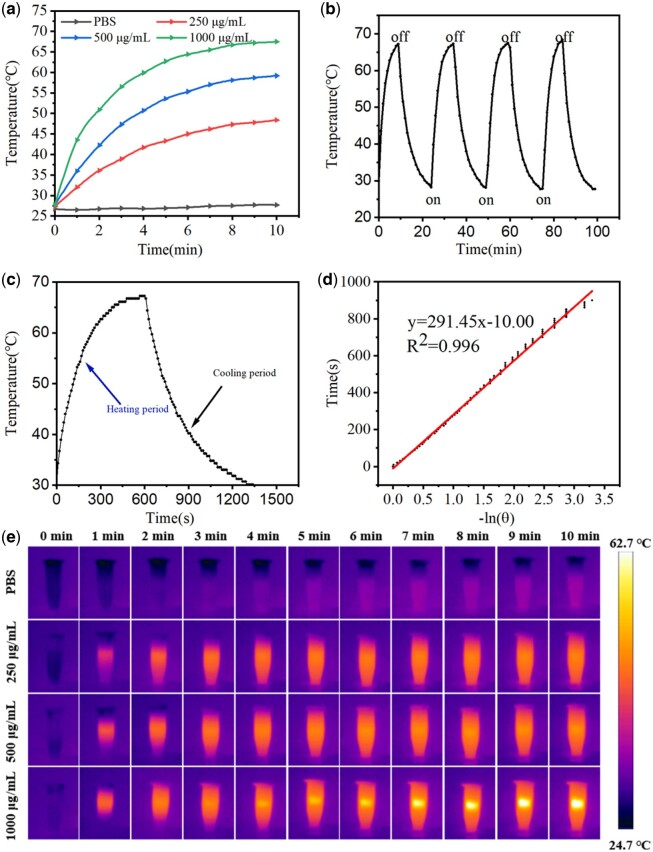
(a) Temperatures of different concentrations (250, 500 and 1000 μg/mL) of IONPs suspensions in PBS under NIR irradiation (1.0 W/cm2) over 10 min. (b) Photothermal heat curves of IONPs (1000 μg/mL) over four NIR irradiation (1.0 W/cm2) on/off cycles. (c) Temperature variation of primary heating and cooling of IONPs. (d) Linear time data versus −ln(θ) obtained from the cooling period of (c). (e) Real-time infrared thermographic images of different concentrations (0, 250, 500 and 1000 μg/mL) of IONPs suspensions in PBS under NIR irradiation (1.0 W/cm2, 10 min).

