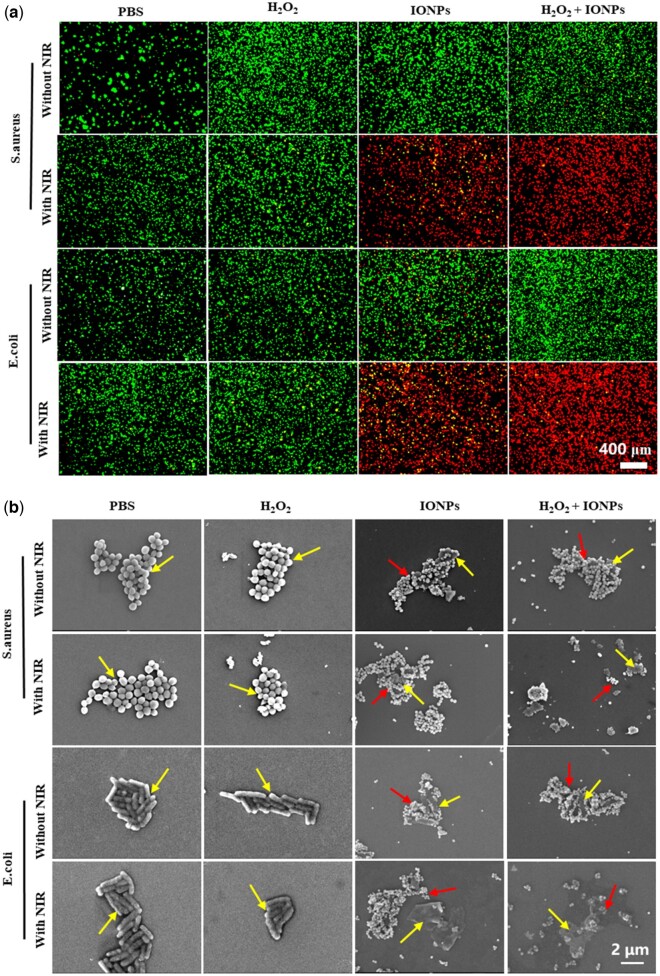
Figure 4.
(a) The fluorescence images of live/dead bacteria after 808 nm NIR treatment in different groups with calcein–AM staining membrane-complete bacteria and PI staining membrane-damaged bacteria. (b) The SEM images show the microstructure of S. aureus and E. coli in corresponding groups. The scale bars are 2 μm. The yellow arrows indicate the bacterial and the red arrows indicate the IONPs.

