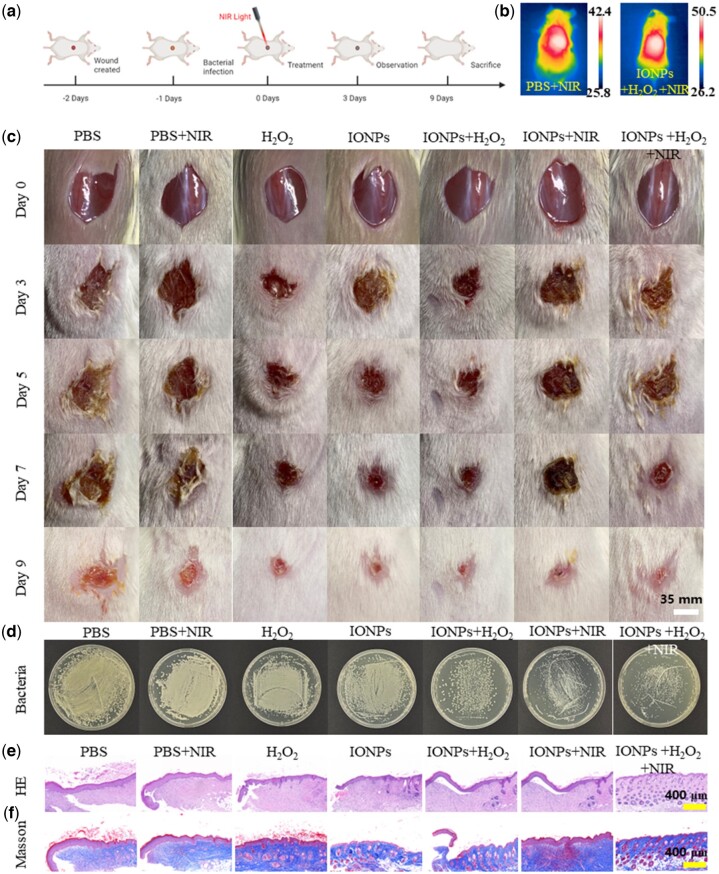
Figure 6.
In vivo antibacterial performance of IONPs. (a) In vivo antibacterial protocol in mice. (b) Thermal image of mice treated with IONPs after 808-nm laser irradiation (1.0 W/cm2, 10 min). (c) Wound photographs of mice after various treatments at different treatment time. The scale bars are 35 mm. (d) Photographs of bacterial colonies after 9 days treatment. (e) H&E and (f) Masson staining of the bacteria-infected tissues after different treatments. The scale bars are 400 μm.

