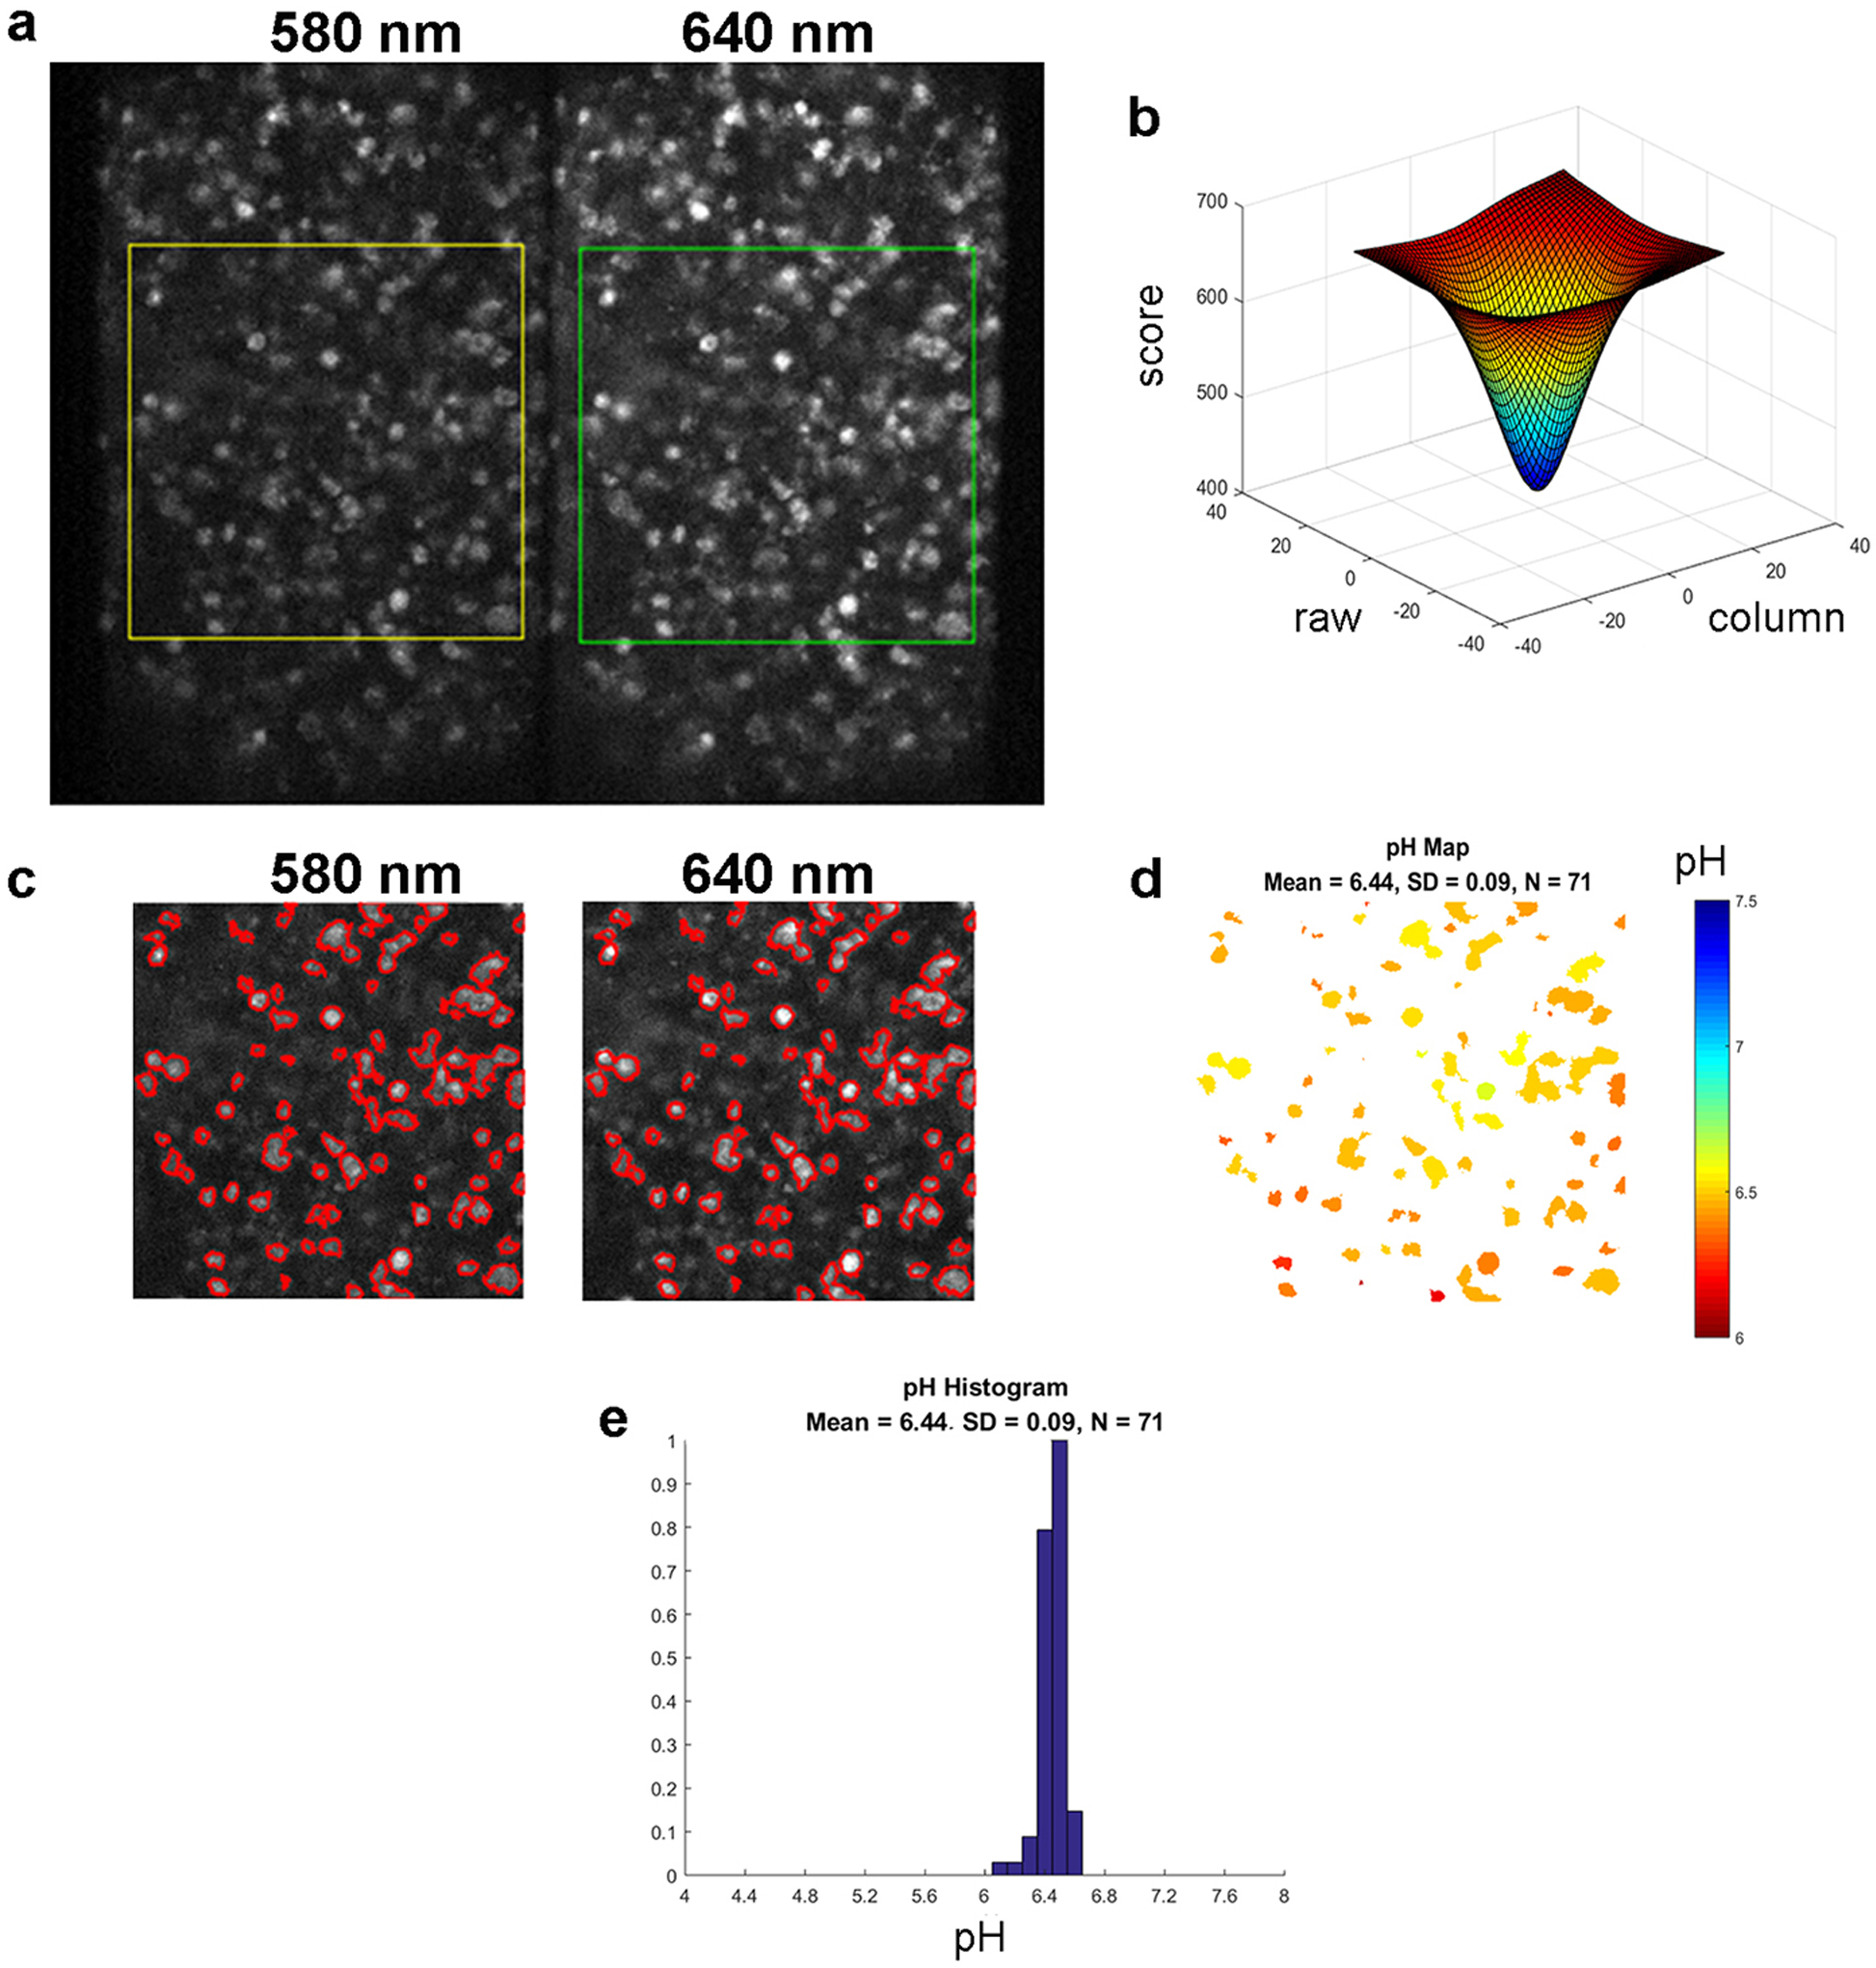
Figure 2. The image analysis.

SNARF fluorescence images of N4A4 cells at 580 nm and 640 nm (a) were obtained using a DV2 beam splitting system and 579±17 nm and 647±28.5 nm emission filters, respectively. The area of interest is selected by squares. The differences in intensity values in each pixel at the center (within the region of ±25 pixels) between 640 nm and 580 nm image regions (b) were used to adjust the 580 nm image position to minimize the intensity differences (achieve the smallest score) and thus to align images for further processing. Image correction, intensity and size cutoff were used to establish the cell border outlines shown in red (c). Examples of a pH map (d), where pH values are indicated by different colors, and a pH histogram (e) for the selected region from (a) are shown.
