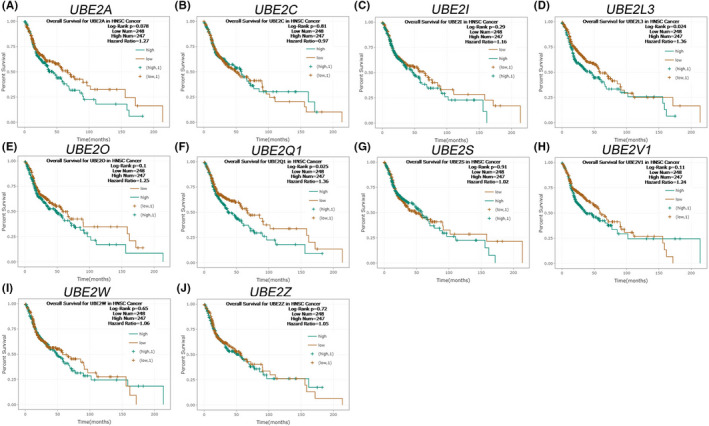
FIGURE 2.

A Kaplan–Meier curve of overall survival, according to the expression of UBE2A (A), UBE2C (B), UBE2I (C), UBE2L3(D), UBE2O (E), UBE2Q1 (F), UBE2S (G), UBE2V1 (H), UBE2W (I) and UBE2Z (J), using an online, publicly available, HNSCC dataset (ENCORI)
