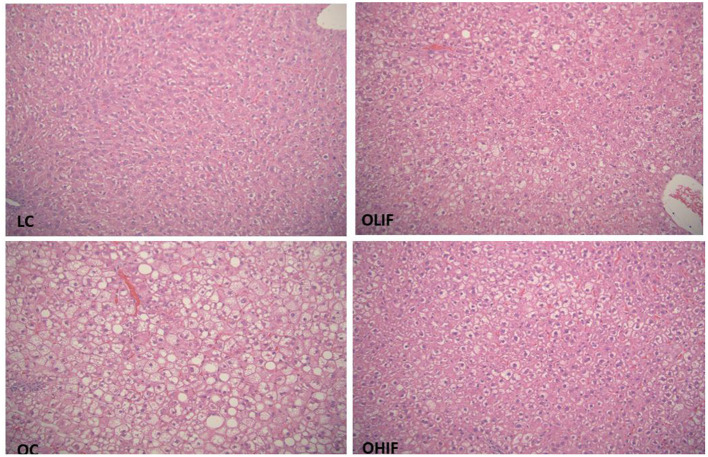
Figure 2.
Liver Steatosis in LC, lean control; OC, obese control; OLIF, obese low isoflavones; OHIF, obese high isoflavones fed rats. LC image shows morphologic features of one of lean sample, there is no evidence of steatosis in any lean samples. OC image shows marked micro and macrovasicular steatosis present essentially in all three zones. OLIF image shows predominantly microvasicular steatosis, predominantly around portal zone. OHIF image shows predominantly microvasicular steatosis, predominantly around portal zone. All images are original at 20 x magnifying power.

