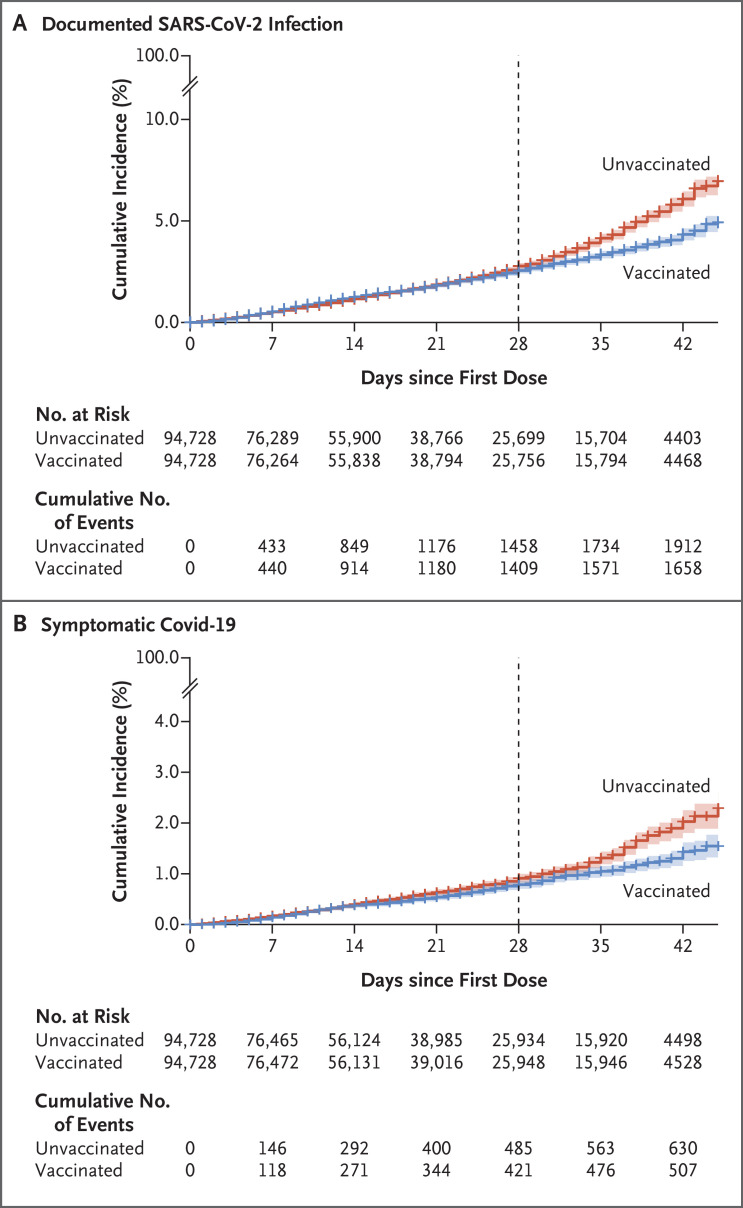
Figure 2. Cumulative Incidence of Documented SARS-CoV-2 Infection and Symptomatic Covid-19.
Panel A shows the cumulative incidence of documented SARS-CoV-2 infection, as confirmed by a positive PCR test. Panel B shows the cumulative incidence of symptomatic Covid-19. The dashed vertical line at day 28 represents 7 days after the second vaccine dose was scheduled to be administered and marks the time at which the main follow-up period starts (in the vaccine effectiveness analysis, the follow-up period for children who did not receive the second dose at the designated time was shifted according to the time they received the second dose). Shaded areas indicate the 95% confidence intervals, and plus signs censored data.

